In the menu bar under Window, you can open another window - the Worksheet Window. There you will find all information about all objects in various overviews:
In these overviews you can add or change information, display it with various filters and sorts, and generate lists for paperwork from it.
The user interface of the Worksheet Window consists of five areas:
Using the overview tabs, you can switch back and forth between different thematic overviews. The structure of the Worksheet Window varies slightly depending on the overview.
In most, but not all, overviews there is a filter area. This can be shown or hidden by clicking on the small funnel to the right of the overview tabs.
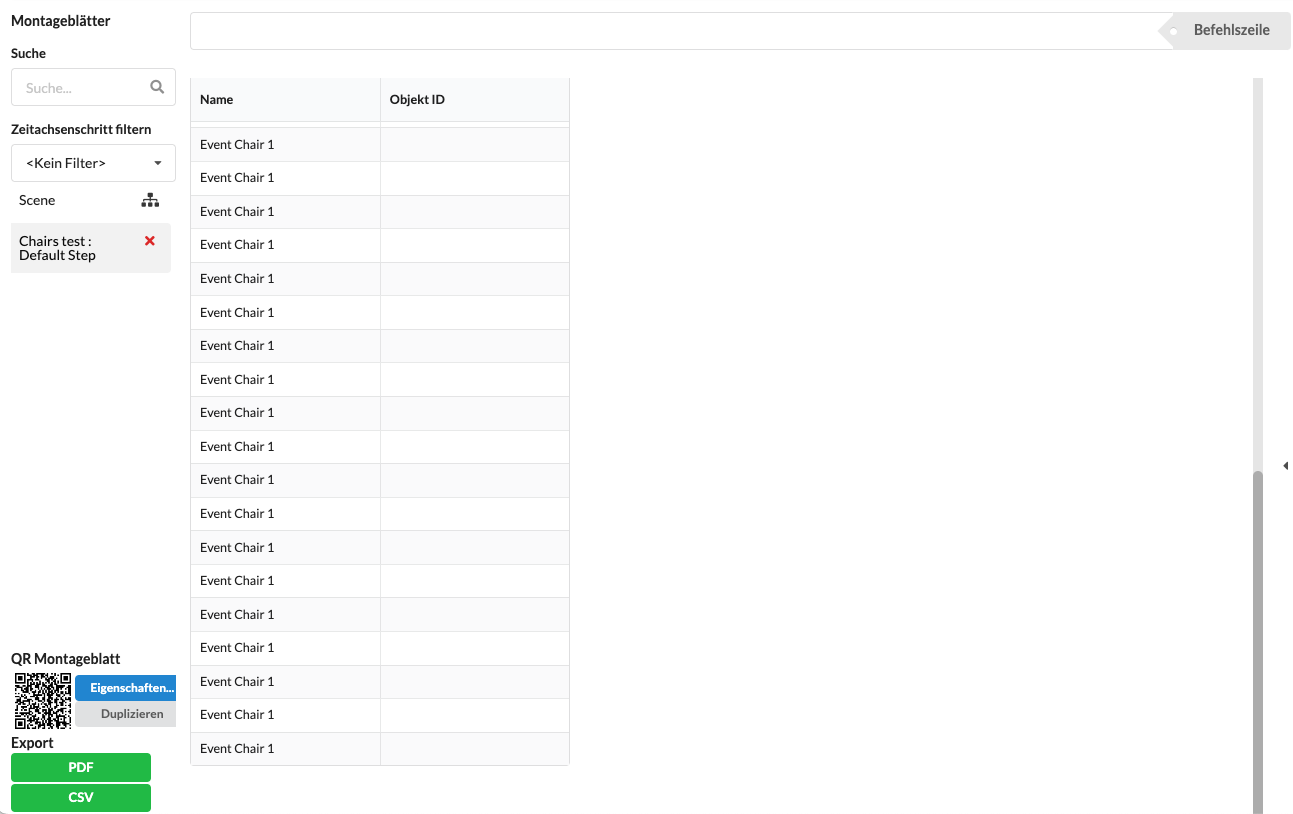
Assembly sheets are overviews for defined assemblies or sub-areas of your drawing. You can create them via the Navigation, the Menu Bar or using Context Menu in the Scene Tree. The Scene object always represents all objects of the drawing in the workspace, the assembly sheets only represent the objects they contain. You can delete unnecessary assembly sheets by clicking on the red cross.
If you have selected an Assembly Sheet, a QR code will also be displayed with which you can access this Assembly Sheet via the online browser.
The workspace/tabular overview shows you all the information. In the Properties overview, you can also edit this information. In all others, they are only displayed according to theme.
By clicking on the column header, you can sort the content by that column, and if you hold down the SHIFT key, you can also sort by multiple columns. By clicking and dragging on the dividing lines of the columns, you can adjust their width. You can change the order of the columns by drag and drop.
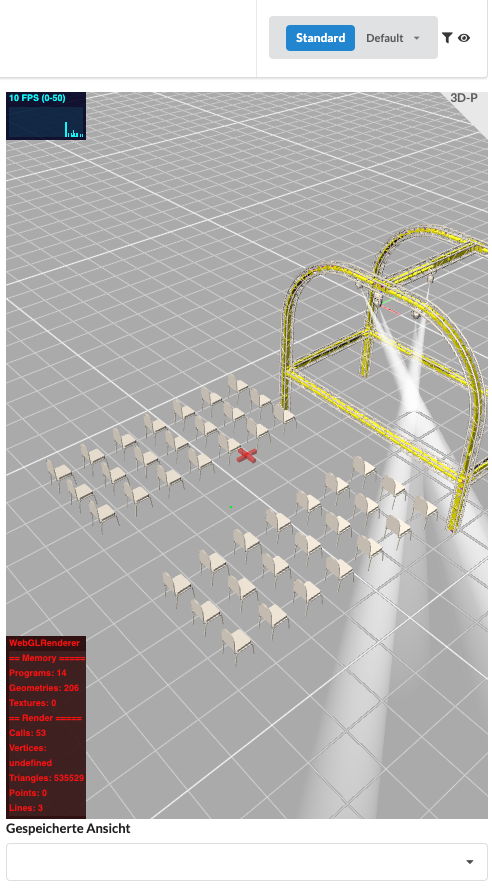
In the right area of the window you can see the rendered representation of the objects in your workspace. To save space, the entire area can be switched on and off using the eye icon to the right of the overview tabs. You can also display saved plan views (Saved View) here.
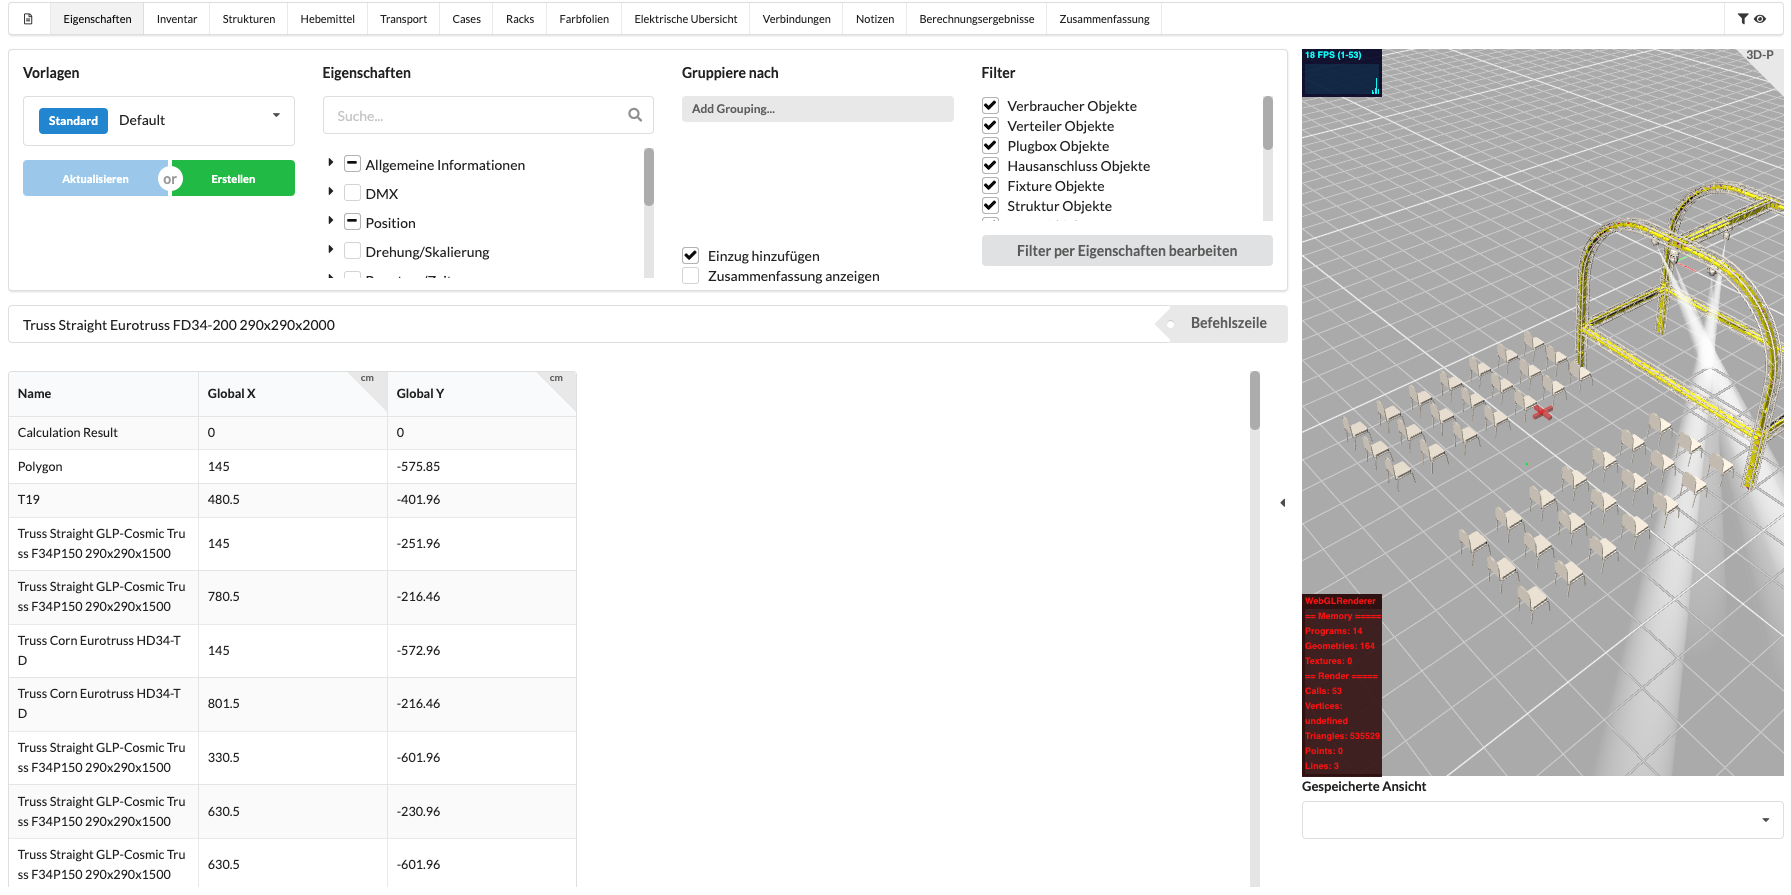
The Properties List (Property List) shows you all properties for all objects in the drawing. Here you can change these properties and, for example, make the network patch. In order to do this effectively, you have several options available to filter the table.
Presets offer you the possibility to save collections of properties and filters in order to recall them later or export them as a PDF. To do this, you put together your tabular overview as desired and then press the green "Create" button. After you create a name for your preset, it appears in the list. There are already pre-made presets there. If you want to update your preset, call it up, make the changes, and then press the blue "Update" button.
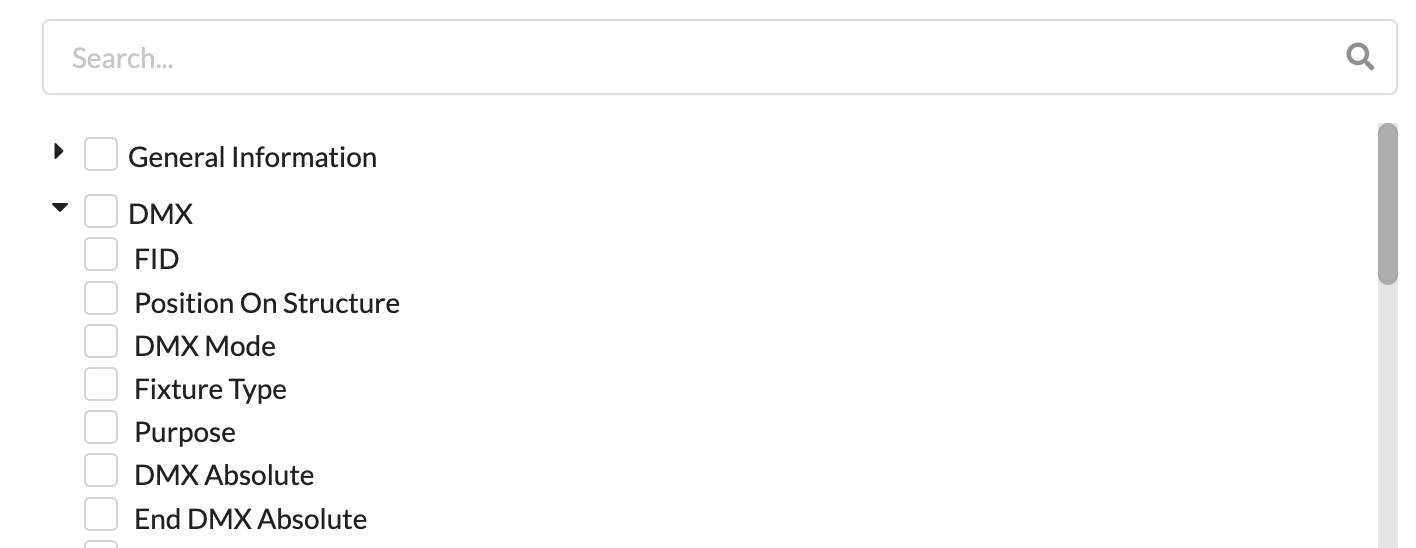
In the Property Fields area, you can toggle each property in the table individually. To find them more easily, you just have to enter the name in the search field and you will only be shown properties with that name.
When grouping, you have the option to select specific properties. Based on these, all matching elements are then grouped together and compiled in a separate table. To do this, you can indent your table to the right using "Add Indent". With "Show Summary" you get a summary under each table.
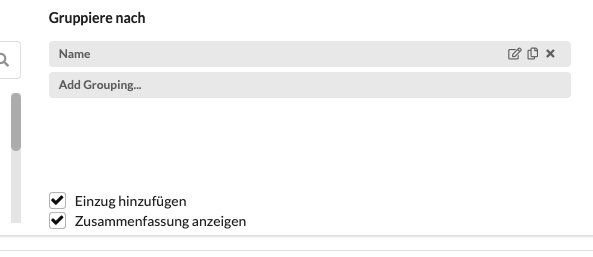
If you want to create groups to organize the data, go to "Add Grouping".
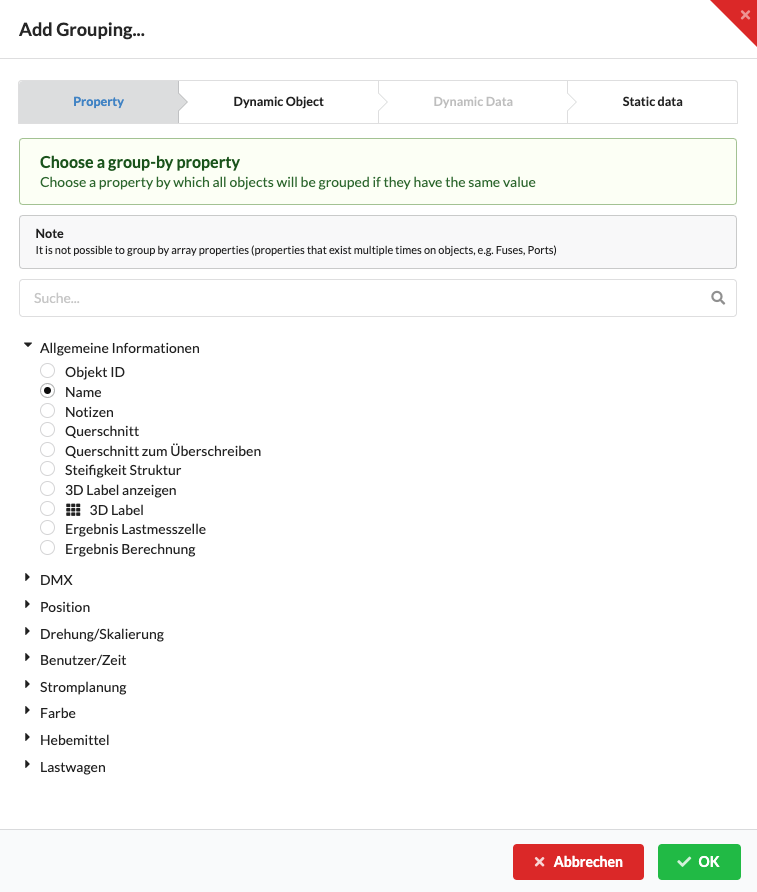
With Properties, you can select a property according to which your table should be organized. You can choose between properties such as "General Information" and "DMX" as well as many others.
With dynamic objects, you can add information to the objects. You can do this in four different ways:
{5x125m, 10x200m, 20x500m}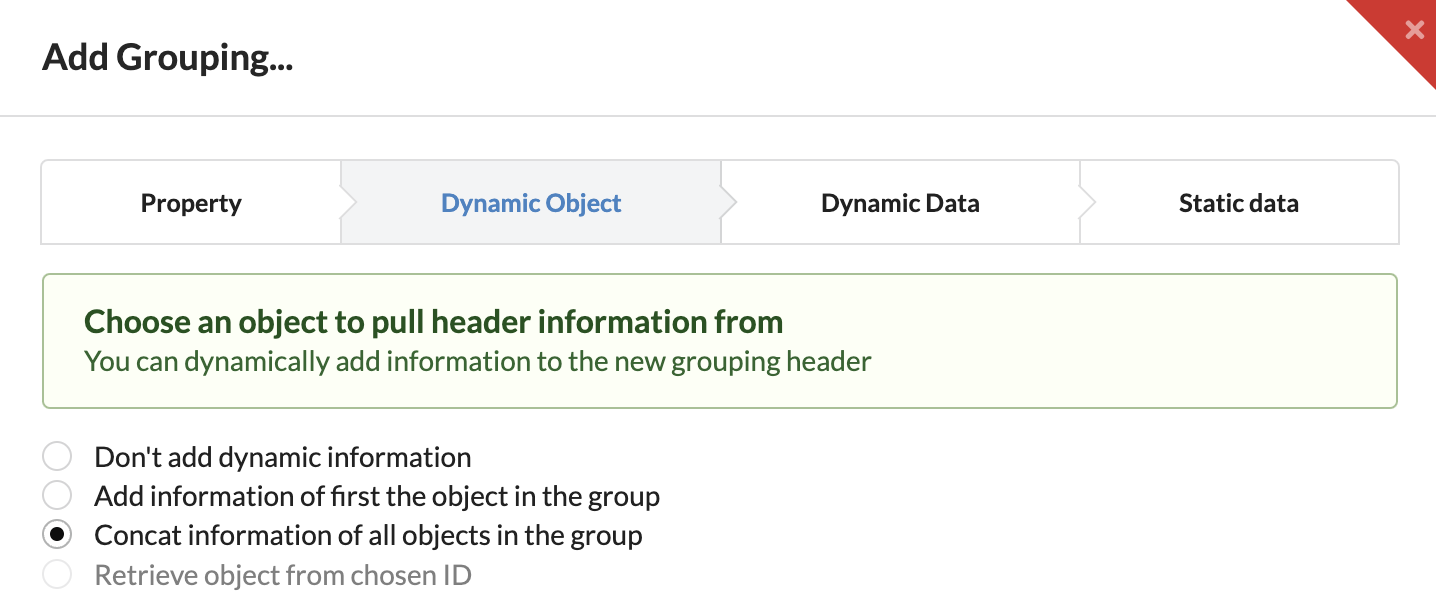
In dynamic data, you can integrate information from the previously selected objects into the header. Multiple properties can also be selected.
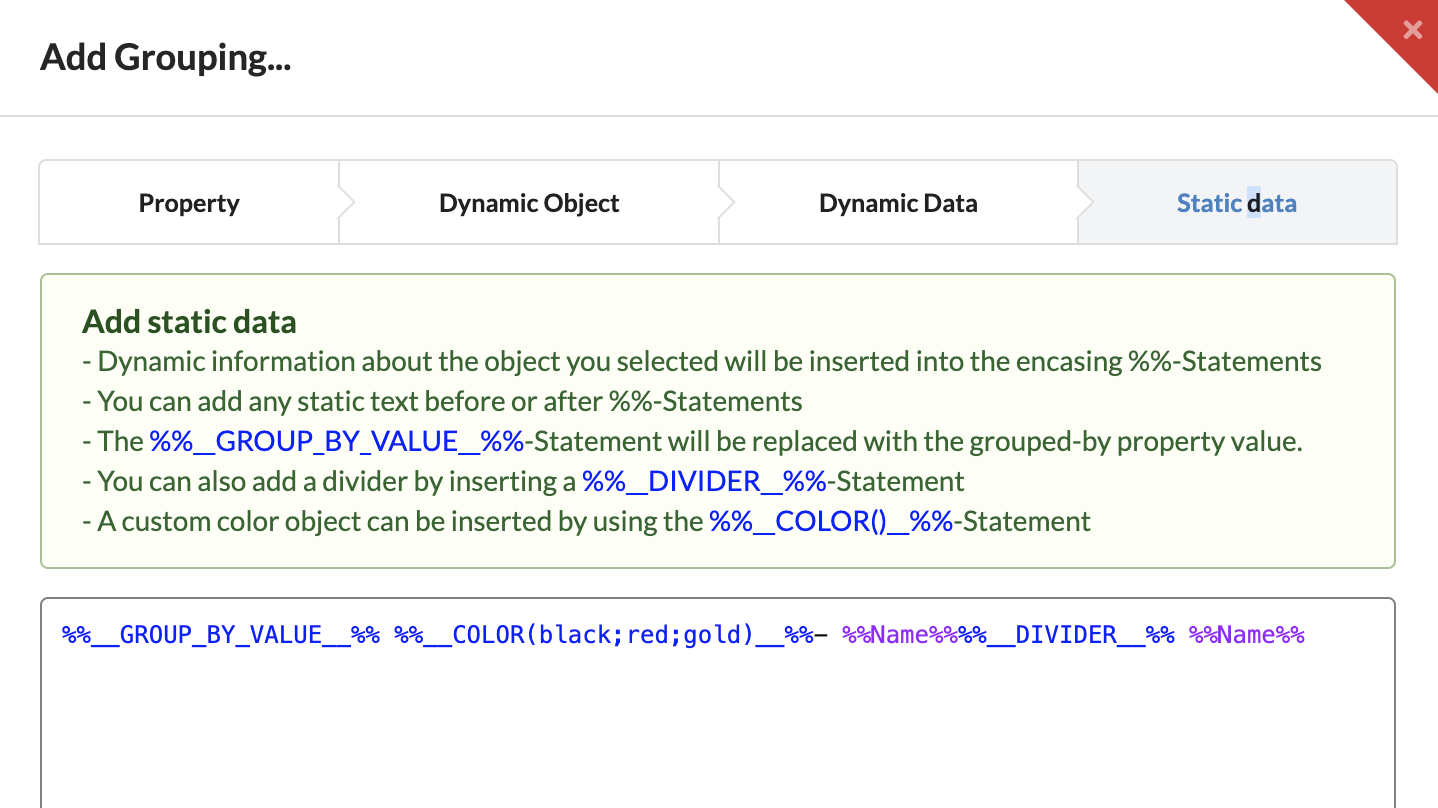
The Static Data tab gives you even more precise configuration options for grouping by inserting additional text-based information. Here we work with placeholders:
%%__COLOR(black;red;gold)__%%%%__COLOR(rgb(128, 64, 0); rgb(64, 0, 256))__%%%%...%%, where ... can be replaced by the name of a property.The Dynamic Data is directly related to the text shown here. If new properties are selected in the Dynamic Data, the corresponding placeholders are automatically inserted here.
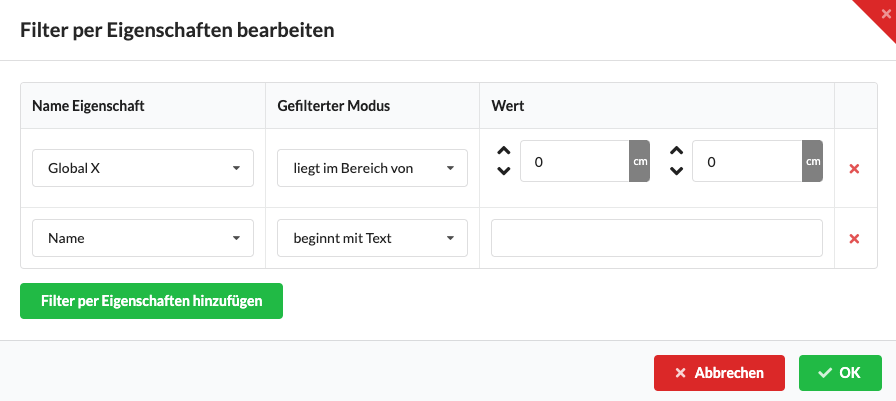
Our software has 2 additional filters: the object filter and the properties filter, which help you further narrow down your objects. The object filter allows you to filter by general groups. The properties filter is used to only display objects with certain properties. This is accessible via the "Edit filter by properties" button.
In the tabular overview, all properties of all objects that you have set with filters are displayed. You can edit them or enter new data by clicking in the cell.
By clicking on the column header, you can sort the content by that column, and if you hold down the SHIFT key, you can also sort by multiple columns. By clicking and dragging on the dividing lines of the columns, you can adjust their width. You can change the order of the columns by drag and drop.
The command line above the tabular overview becomes active as soon as you click in a cell of the table. Here you can also enter commands that make patching easier, for example.
You can find an overview of all commands in the chapter Command Line.
The Material Overview (Inventory List) lists all objects and their number in the drawing. Here you get a quick overview of your material. In addition, a comparison with material management software should be possible in future versions.
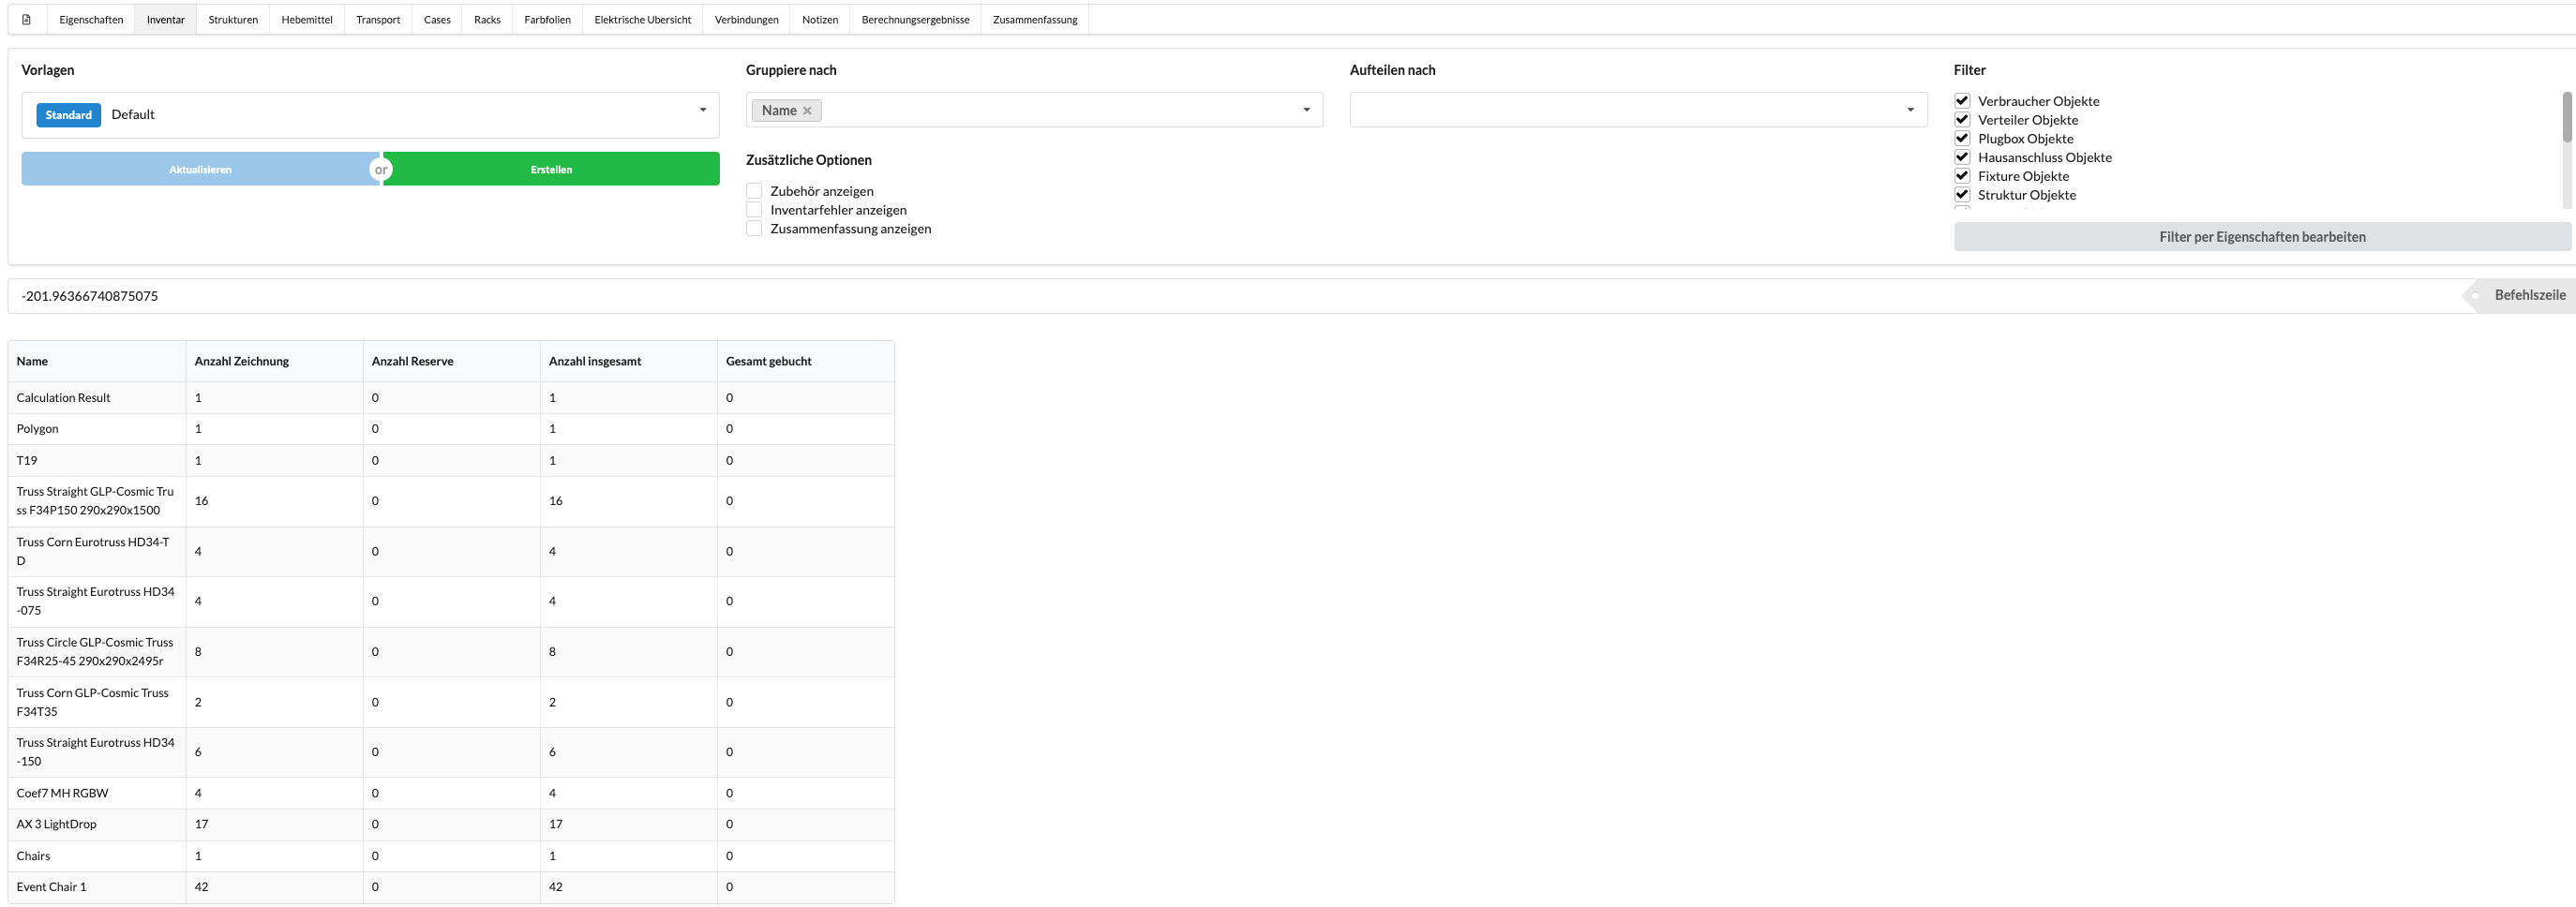
With Group By (Group by), objects can be grouped together in the overview, for example by name, manufacturer, etc. If you select a parameter, it always appears on the left in the table before the count.
With Split By (Summary by), the distribution of the objects to the selected property can be displayed in a small overview.
Presets offer you the possibility to save collections of properties and filters in order to recall them later or export them as a PDF. To do this, you put together your tabular overview as desired and then press the green Create button. After you create a name for your preset, it appears in the list. There are already pre-made presets there. If you want to update your preset, call it up, make the changes, and then press the blue Update button.
See section 2: "Overview of All Properties / Properties"
In the Inventory List, only one column can be edited, namely the Count Spare. All other columns are for display only.
By clicking on the column header, you can sort the content by that column, and by clicking and dragging on the dividing lines of the columns, their width can be adjusted. You can change the order of the columns by drag and drop.
In the Structure List, you will find an overview of the trusses sorted by truss system. It shows you what elements the system consists of, what its own weight is, what the total load on the system is, as well as its total length.

The tabular overview in this list is mainly for viewing purposes. Except for the color code, its content cannot be edited.
By clicking on the column header, you can sort the content by that column, and by clicking and dragging on the dividing lines of the columns, their width can be adjusted. You can change the order of the columns by drag and drop.
The Support List gives you an overview of all motors in your drawing: their position, their loads, and their function. Here you can easily generate a markout list.

Under Hoist Sorting, you can choose between two different ways the motors in the list should be sorted for measurement:
Here the workspace is only for display; you cannot edit any data.
By clicking on the column header, you can sort the content by that column, and by clicking and dragging on the dividing lines of the columns, their width can be adjusted. You can change the order of the columns by drag and drop.
The Truck List gives you an overview of the required number of trailers and offers you the possibility to create a loading overview.
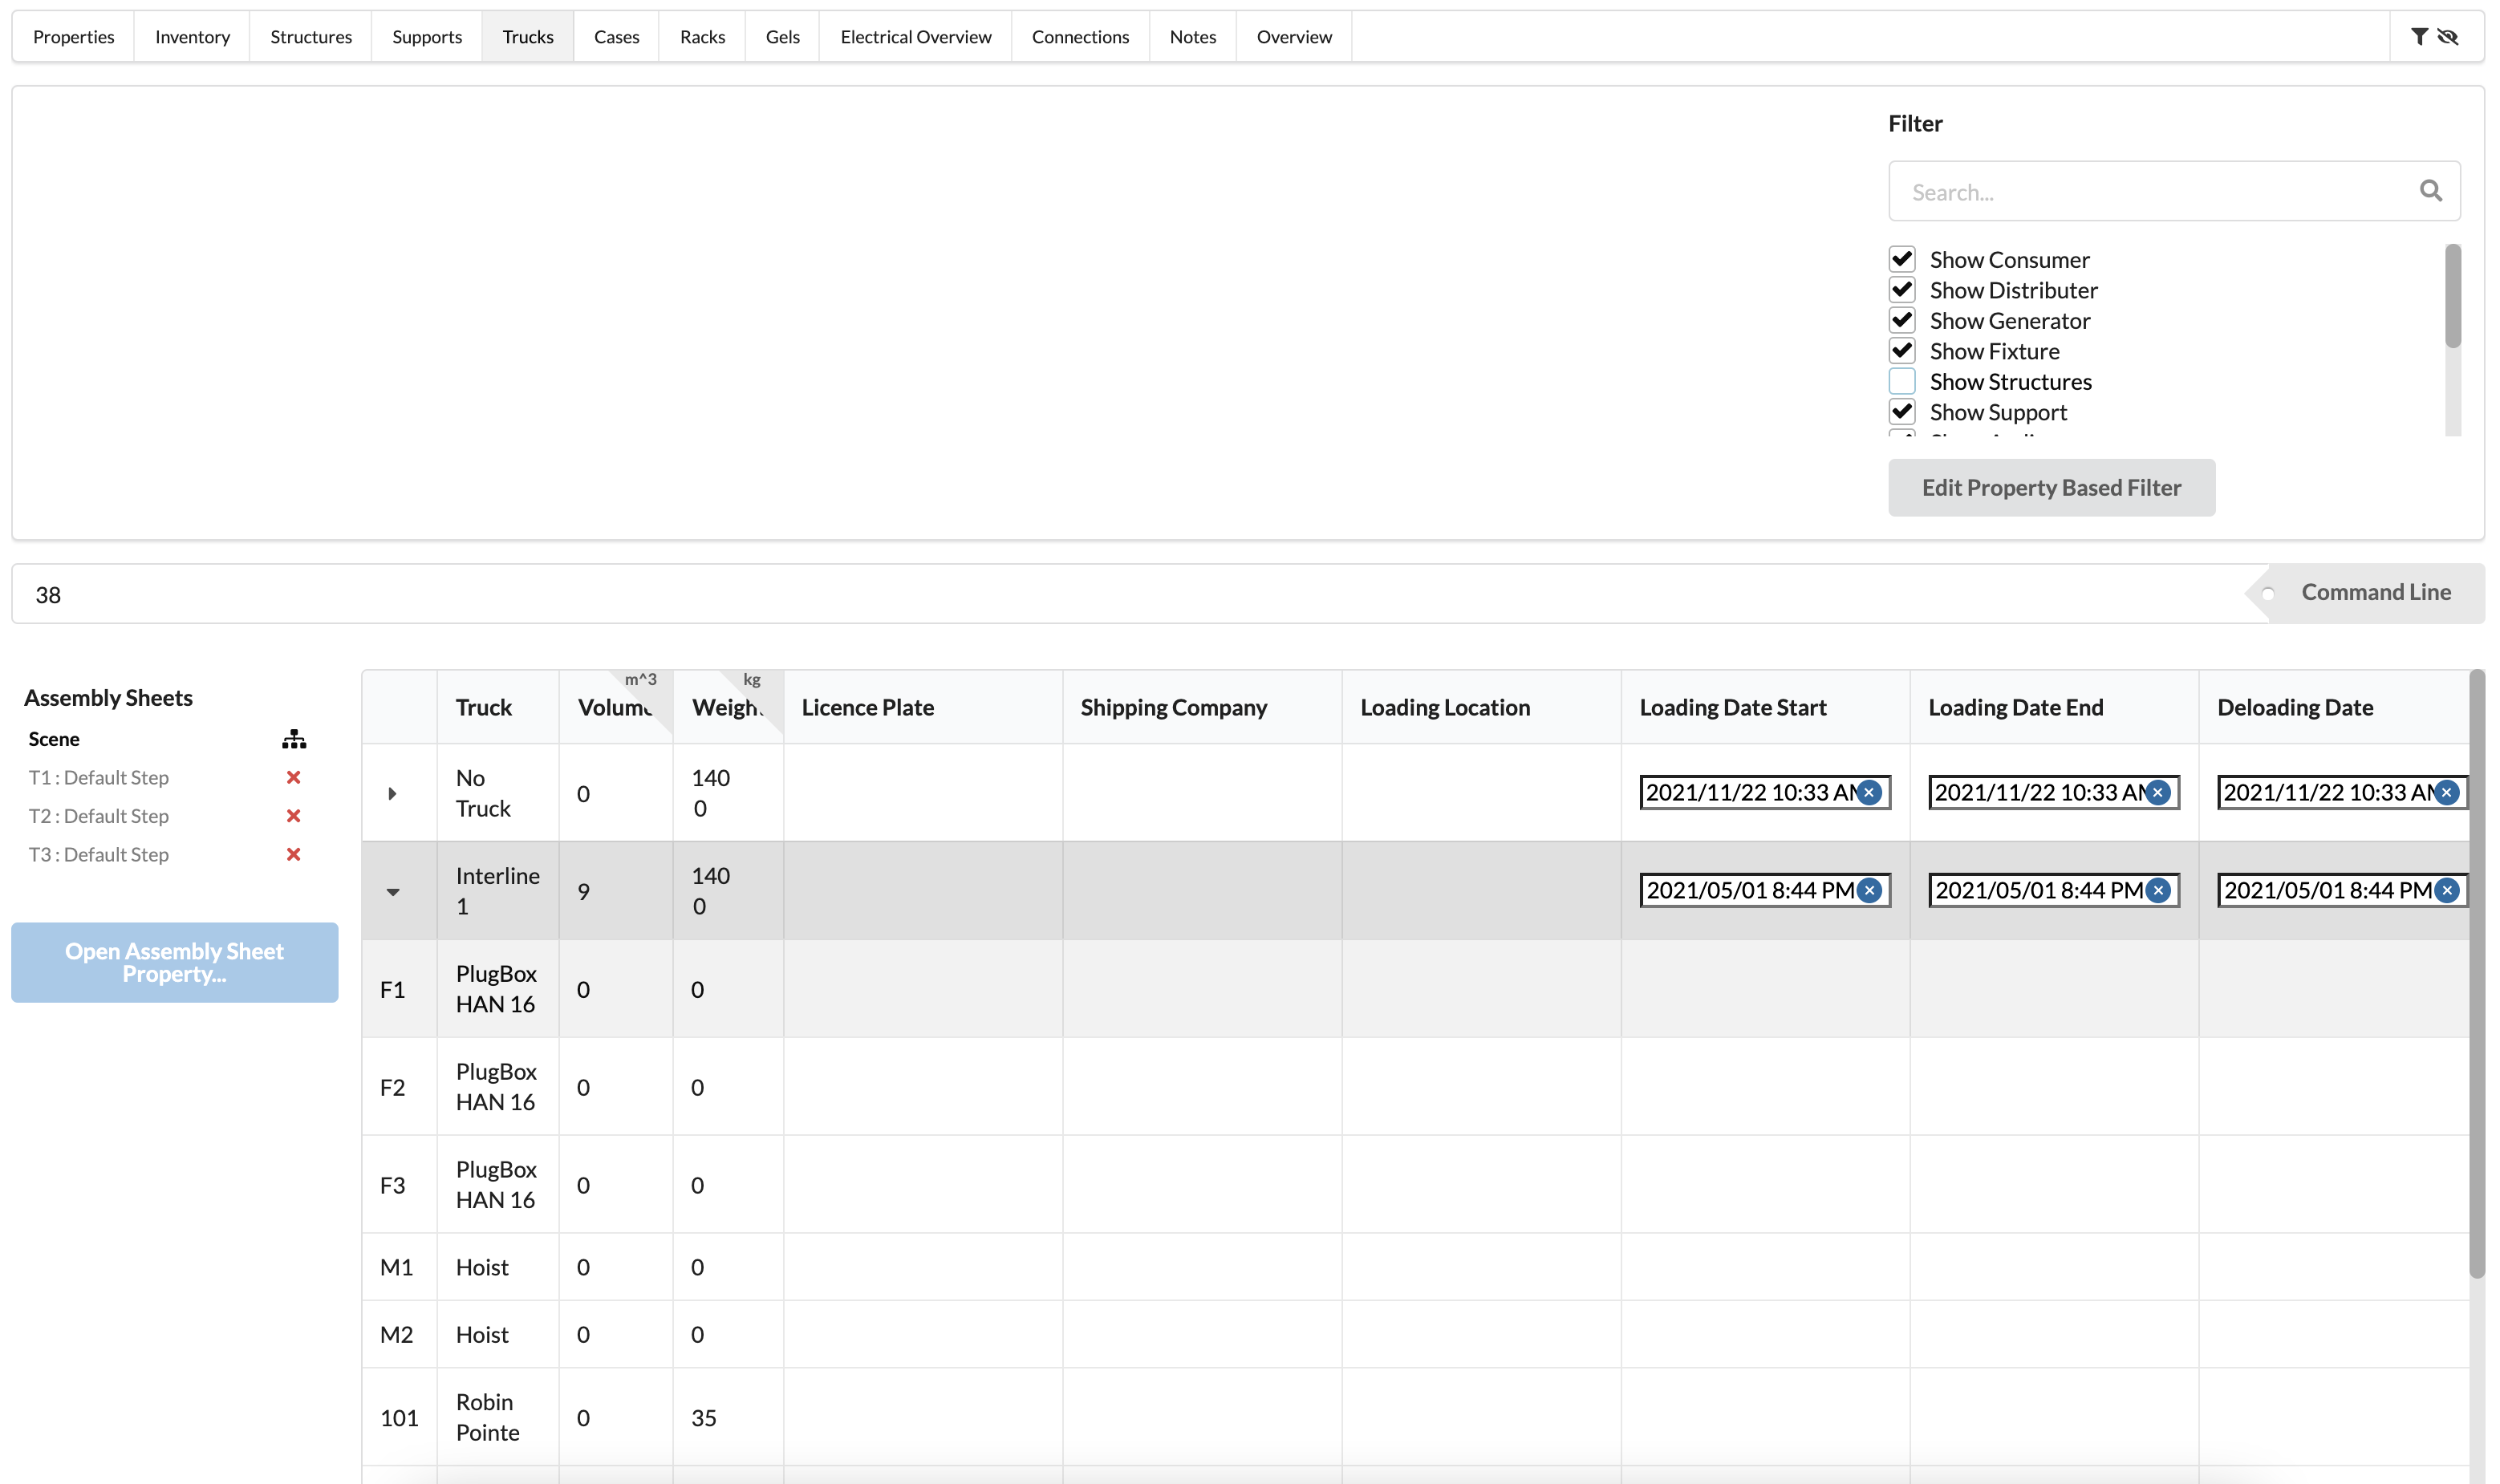
The Properties Filter is used to display only objects with special properties. For example, you can enter a range of Fixture IDs here and only Fixtures in that range will be displayed.
See section 2: "Overview of All Properties / Properties"
In this list, you can only edit the loading and unloading data. If you want to change other data about the trailer or create new ones, you can do so in the Navigation. Objects are added to the corresponding trucks in Object Properties.
By clicking on the column header, you can sort the content by that column, and by clicking and dragging on the dividing lines of the columns, their width can be adjusted. You can change the order of the columns by drag and drop.
In the Cases (Case List), you will find an overview of the number of required cases and their contents.
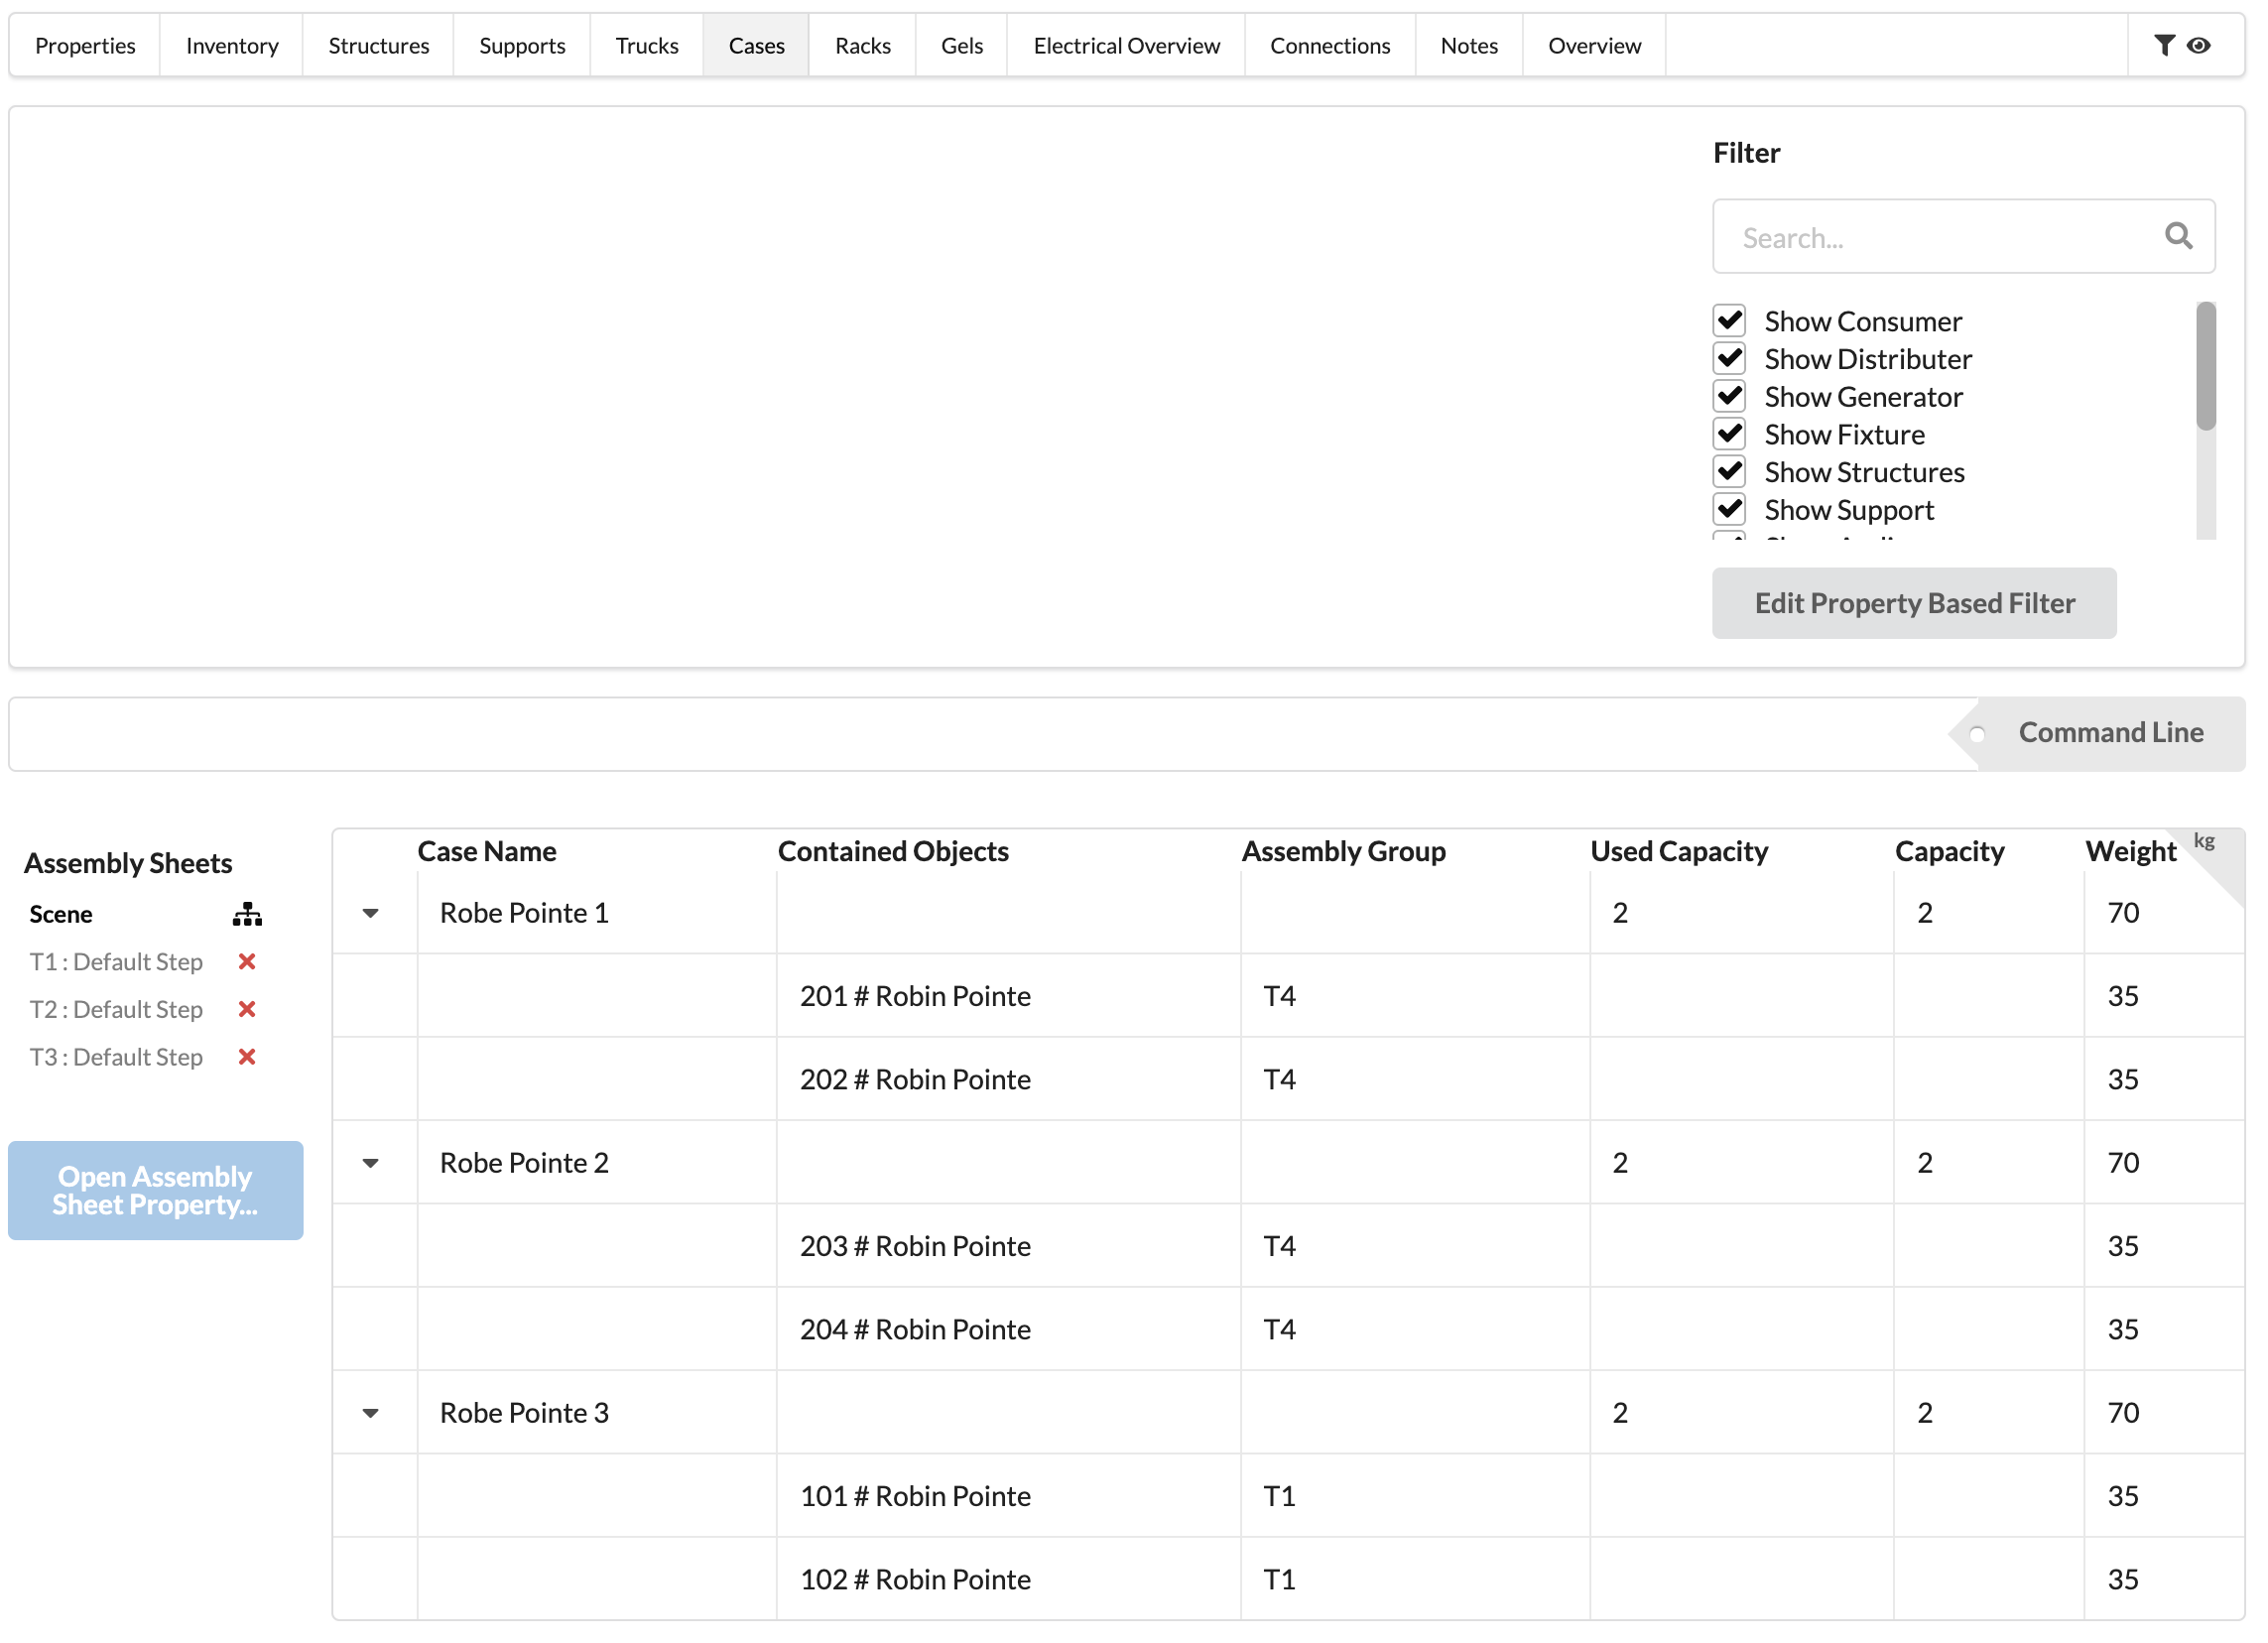
See section 2: "Overview of All Properties / Properties"
This list only serves as an overview and cannot be edited.
In the Rack List, it is shown which objects are installed in which racks. The number before the object name/Object ID shows you the position in the rack.
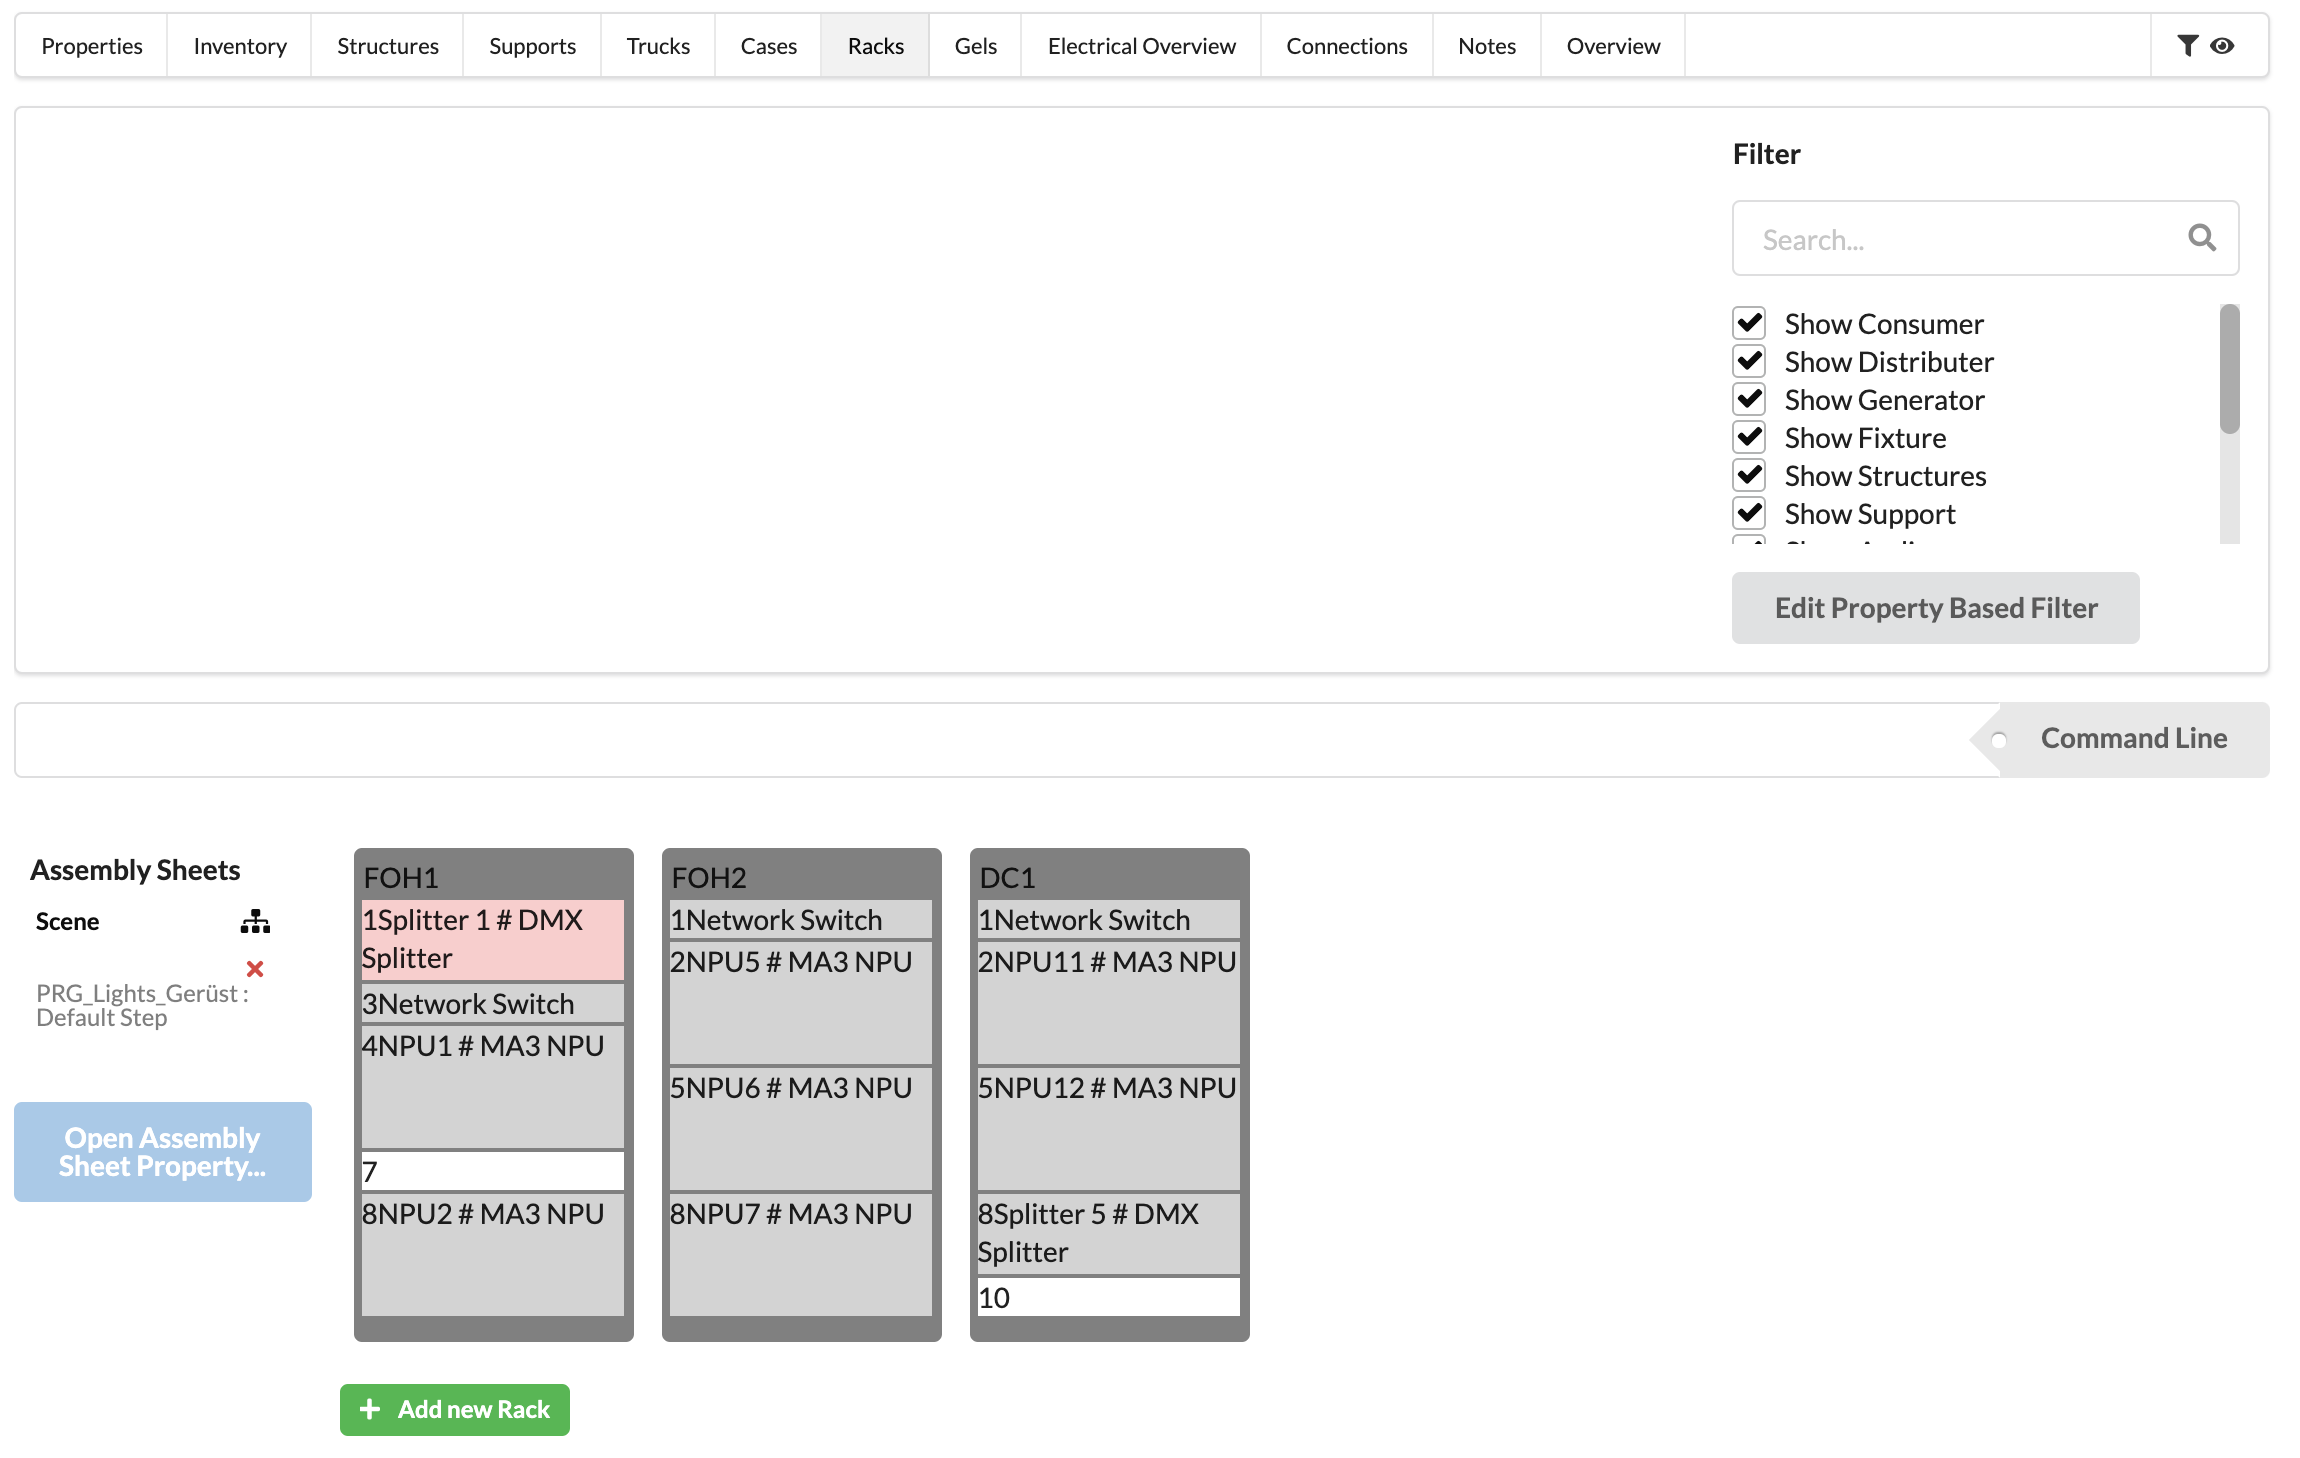
See section 2: "Overview of All Properties / Properties"
You can drag and drop objects to free positions in other racks. You can also change the position of the object in Object Properties.
You can also create new racks here. This is also possible in Navigation.
Templates for rack sizes are managed in the Resource Manager.
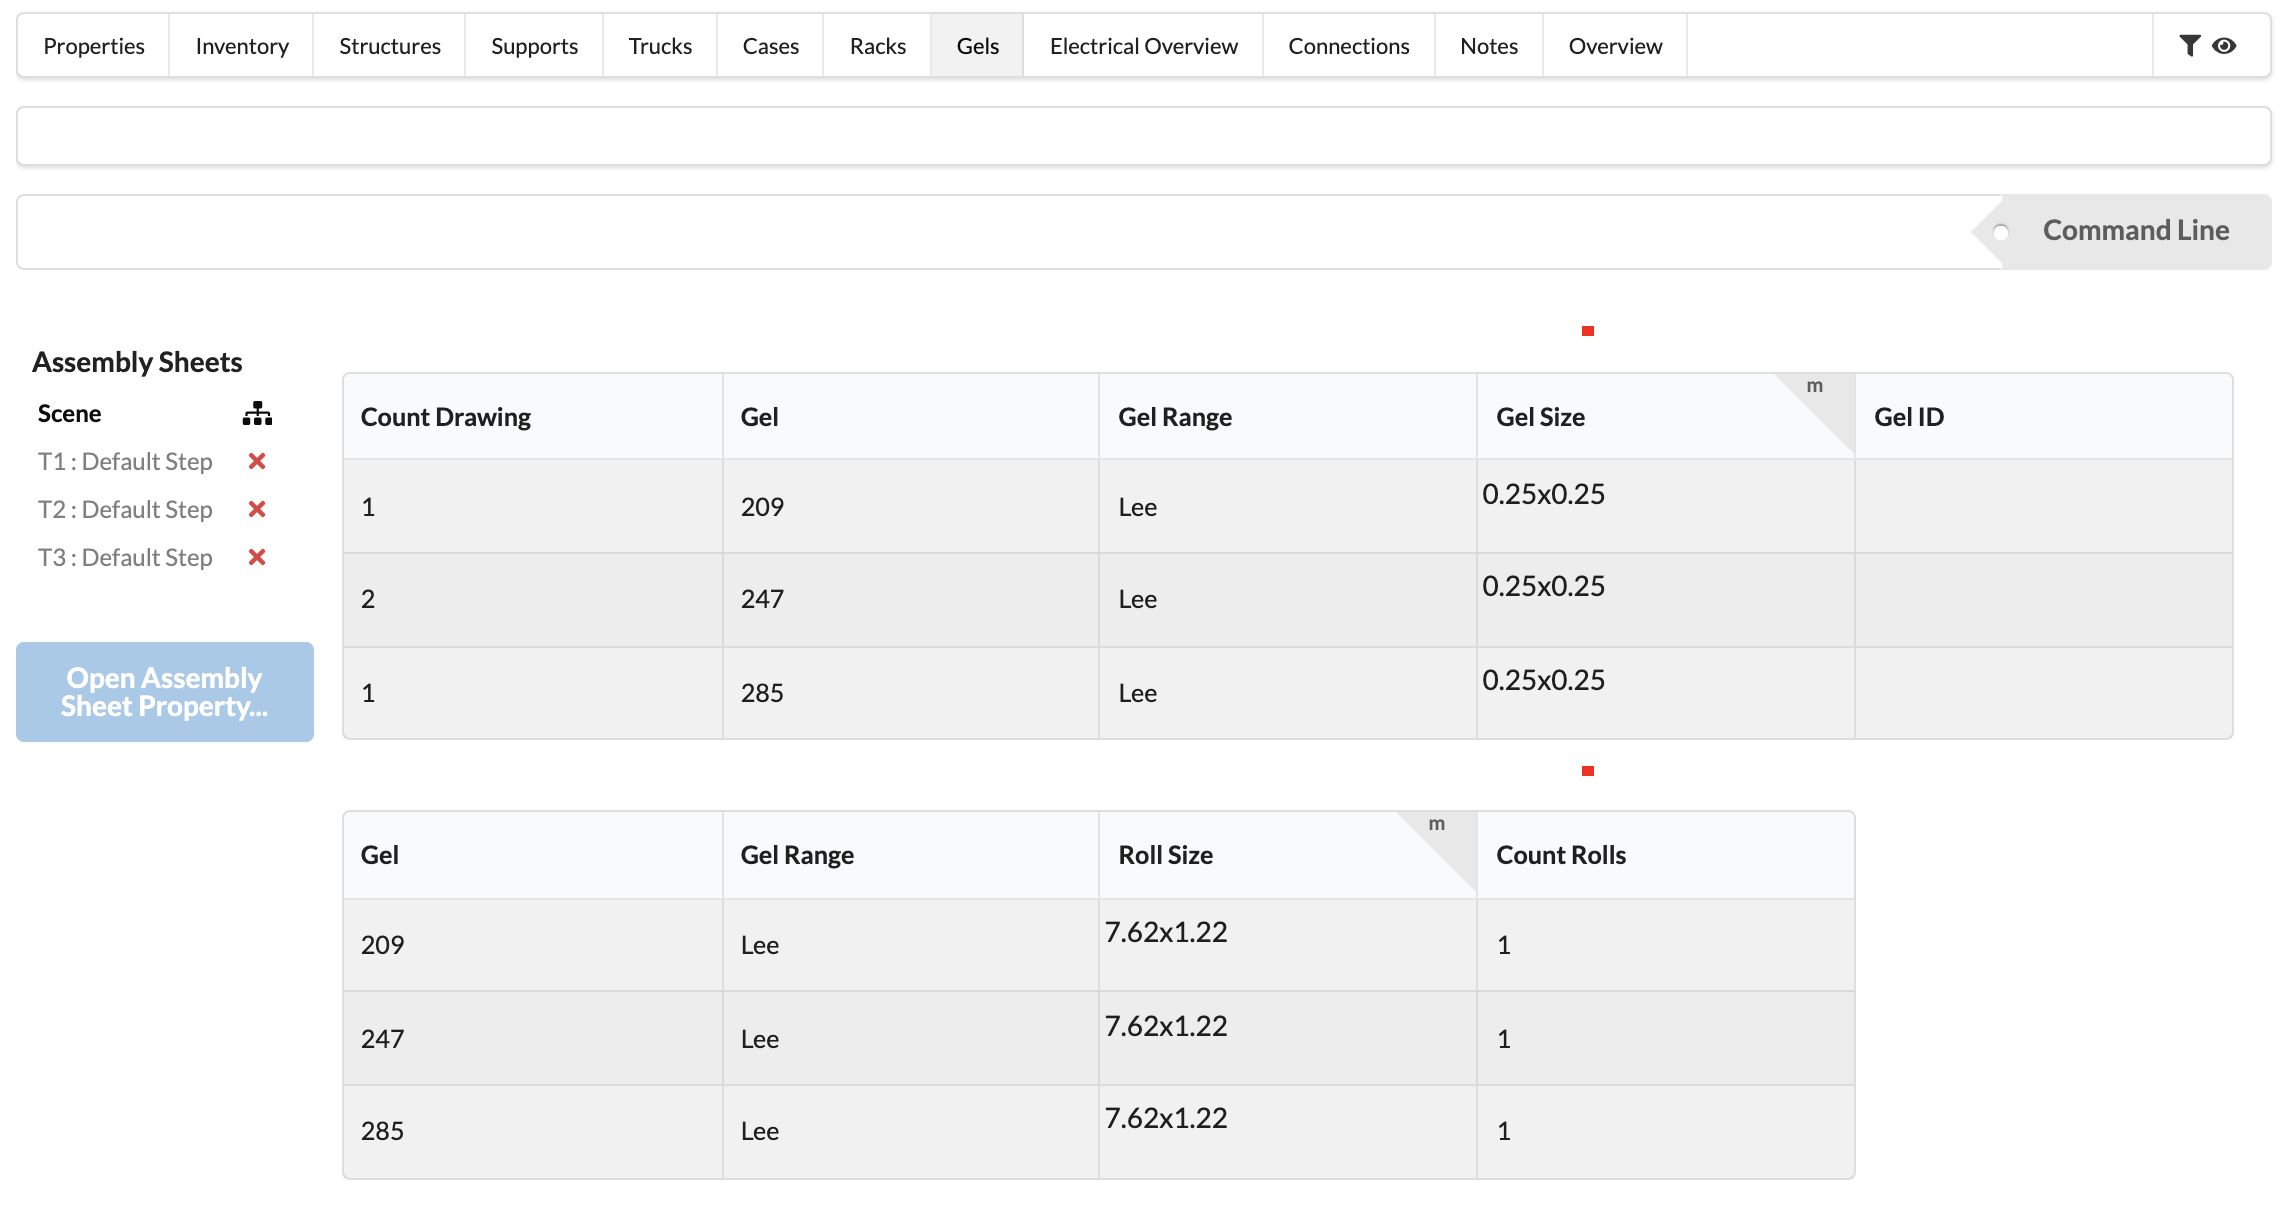
The Color Foils (Gel List) offers you an overview of the color foils used, the number and size of the required cuts, and the number of rolls required.
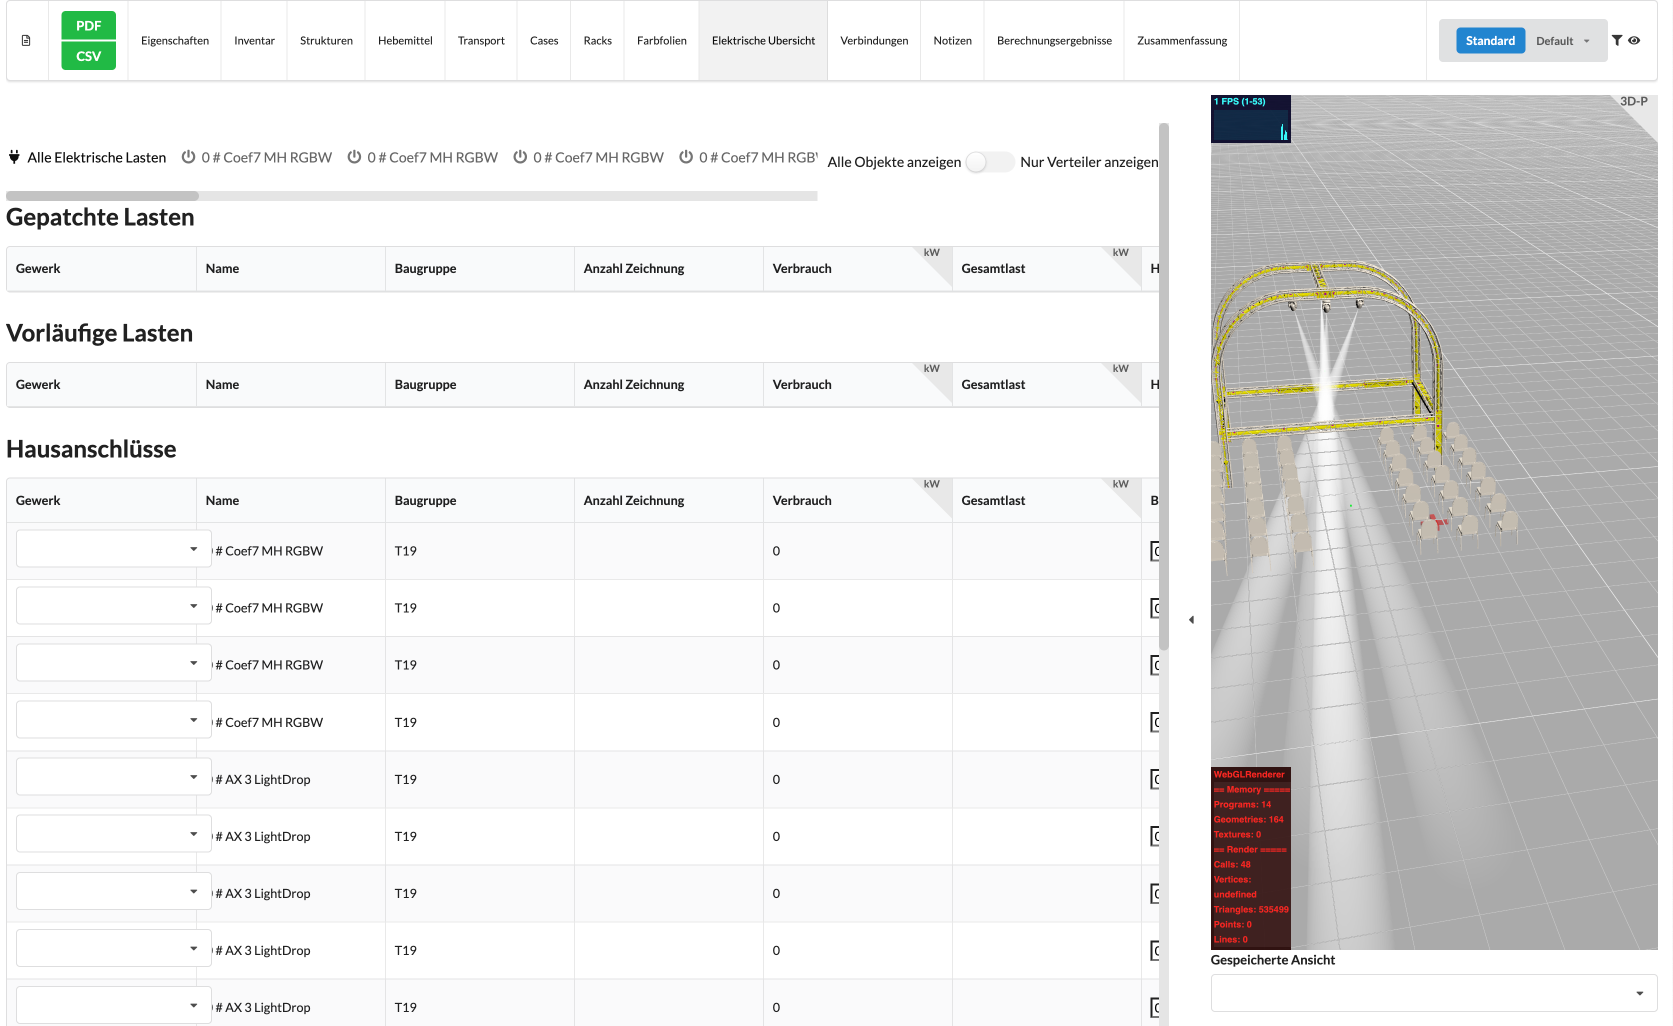
Here an overview of all electrical objects is displayed that do not have their own higher-level generator or distributor, that is, they are at the top of the electrical tree. If desired, this list can be filtered to show only real distributors and generators by enabling Show Distributors Only.

If All Electrical Loads is selected, an overview of all objects is displayed:
-Patched loads are devices that have already been successfully connected.
-Temporary loads are devices that have not yet been connected.
-House connections is a list of all distributors.
If a distributor or generator has been selected, the patched and temporary loads connected to it are displayed.
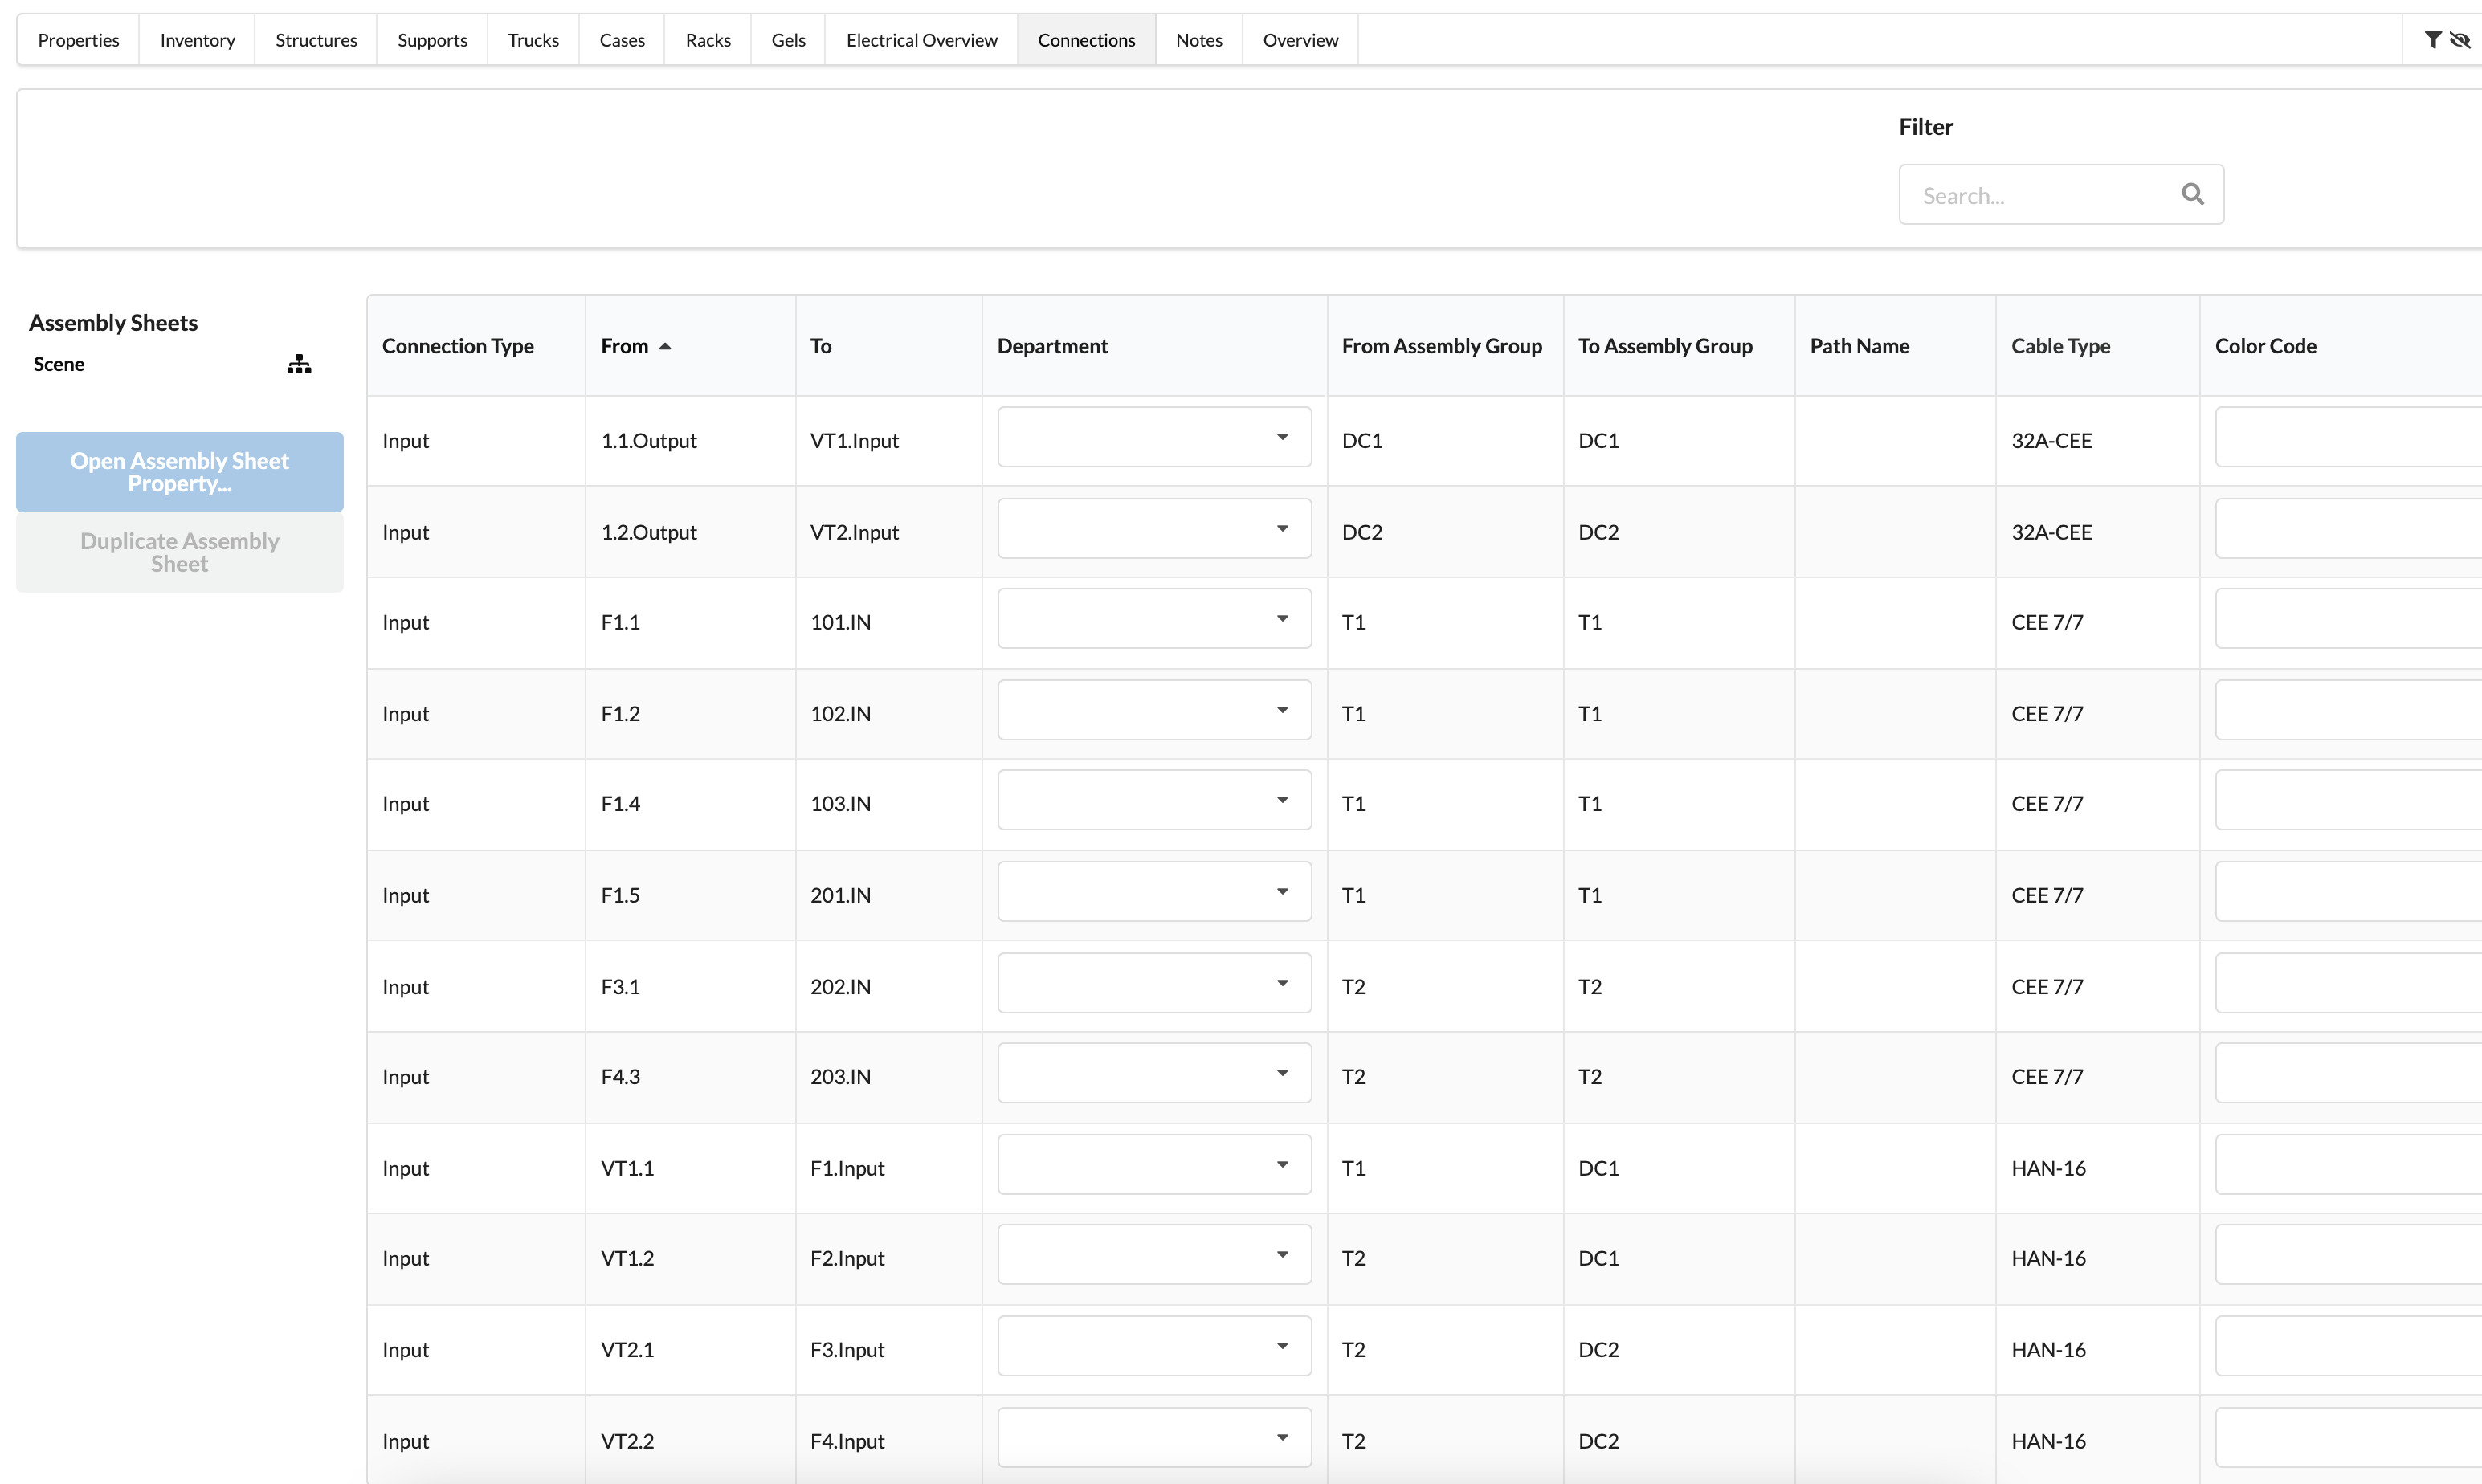
The Electrical Connection List shows the electrical connections of each object. Cable lengths can also be defined here later.
In the Notes section, you can add and manage important notes, comments, or tasks for objects in the assembly sheet. With the filter options, you keep track of read and completed notes to make the work process efficient.

| Name | Description |
|---|---|
| Notes | Displays all notes for objects in the assembly sheet. |
| Add Note | Adds a new note to an object in the assembly sheet. |
| Filter: Read | Filters notes to show only those marked as "Read". |
| Filter: Completed | Filters notes to show only those marked as "Completed". |
| Notes for objects in this assembly sheet | Shows the area where all created notes are displayed. |
To create a new note, click on Add Note in the Notes section. A text field will then open where you can write and save your note.

| Name | Description |
|---|---|
| Write | Allows writing and editing notes. |
| Preview | Shows a preview of the created note in final format. |
| H (Heading) | Adds a heading to the note. |
| B (Bold) | Highlights text in bold. |
| I (Italic) | Formats text in italic. |
| S (Strikethrough) | Strikes through text. |
| Code | Formats text as code block. |
| Insert Image | Allows adding images to the note. |
| Saved View | Links the note with a saved view in the assembly sheet. |
| Assembly Sheet | Links the note directly to the current assembly sheet. |
| OK | Saves the created note. |
| Cancel | Aborts the process and closes the note window. |
In the Calculation Results section, you can evaluate the load distribution, load capacity, and stability of the structure. Errors and warnings help identify overloads, insufficient supports, or structural problems.

| Name | Description |
|---|---|
| Calculation Status | Shows the current status of the static calculation. |
| Order Verified Statics | Button to request an external static calculation for more accurate results. |
| Errors / Info | Lists detected issues such as failed supports or missing loads. |
| FEM Nodes | Indicates that a node of the Finite Element Analysis (FEM) has failed. This often happens when the system is not properly connected or supported. |
| Frames Intersecting | Indicates that two trusses overlap. Such intersections lead to calculation errors or incorrect load assumptions. |
| Load No Weight | A load object in the system has no assigned weight. Without weight, the calculation cannot be performed. |
| Rigging Points | Shows the load at the attachment points of the structure. |
| Chain Hoists | Shows the load distribution to the chain hoist points. |
| Drops | Shows loads on the connecting elements between structures. |
| Bridle | Visualizes the load distribution in the rope connections. |
| Cross Sections | Shows the load on the structural elements, color-coded by utilization. |
| Chain Shortening Effect as Comparison | Calculates the effect of chain shortening based on a reference. |
| Chain Shortening Effect of Utilization | Shows how chain shortening affects load distribution. |
| Ground Supports | Shows the load and stability of the ground supports. |

In the Cross Sections section, the calculated loads and utilization of the individual structural elements are displayed. This overview helps identify critical areas and ensure the stability of the structure.
| Field | Description |
|---|---|
| Cross Sections | Shows the calculation of loads and utilization of individual structural elements. |
| HD34, HD44 | Grouping of individual structural elements by type (e.g., HD34 and HD44). |
| Name | Designation of the structural element or connection. |
| Object ID | Unique identification number of the object. |
| Value | Current load (e.g., moment, force, or other relevant values). |
| Maximum Value | Maximum allowable value for the load on the structural element. |
| Utilization | Percentage utilization based on the current value and maximum value. |
| Green: Low utilization, Yellow: Medium utilization, Red: Critical utilization. | |
| Zoom and Select | Button to zoom in and highlight the respective structural element in the 3D renderer. |

In the Chain Shortening Effect as Comparison section, the change in chain length is displayed based on a reference calculation to identify differences and potential deviations.
| Field | Description |
|---|---|
| Chain Shortening Effect as Comparison | Shows the comparison of chain length between current and reference calculation. |
| X-Axis (M3 # Rope - Rope) | Designates the connection between two points whose length change is measured. |
| Y-Axis (Range 0.94 – 1.06) | Indicates the relative change in chain length. The value 1.00 shows that there is no deviation. |
| Line (Green) | Visualizes the measured change. A continuous line at 1.00 means no deviation. |
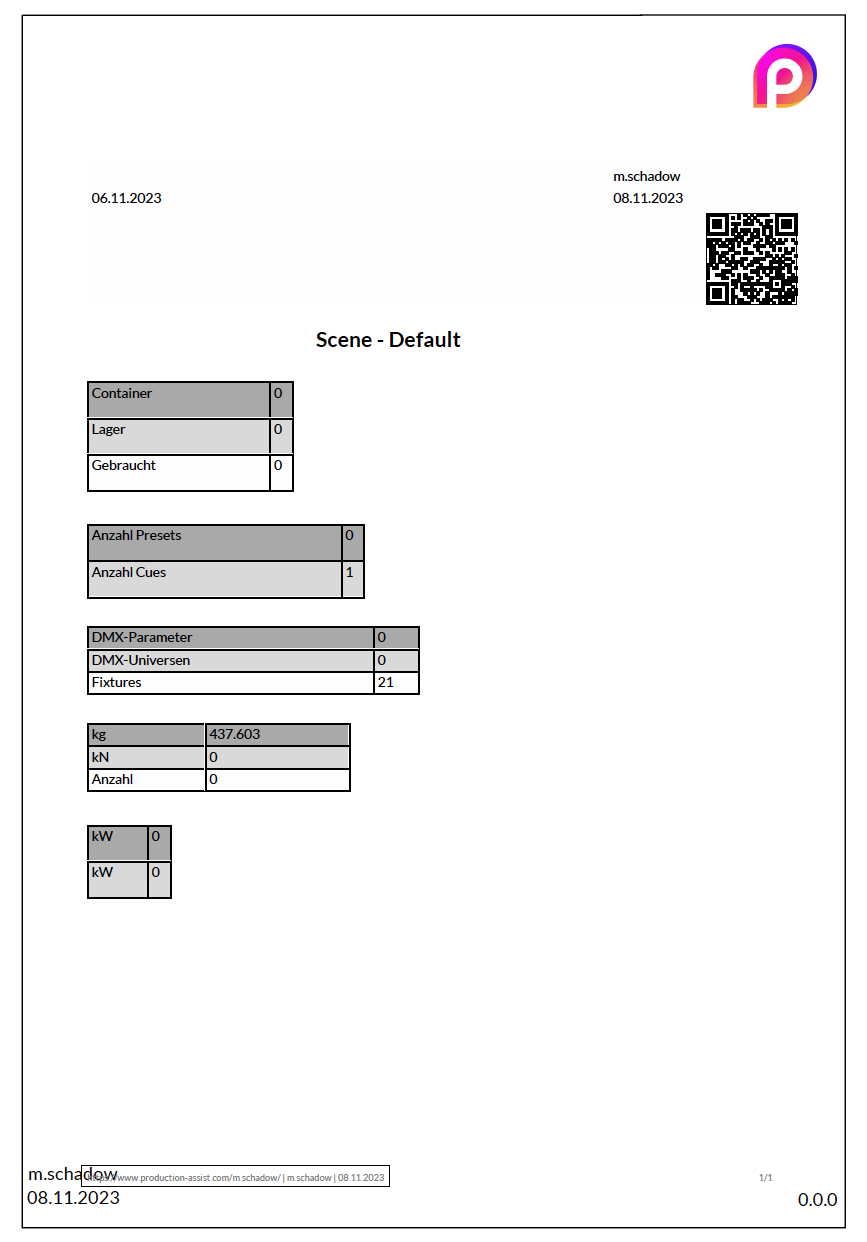
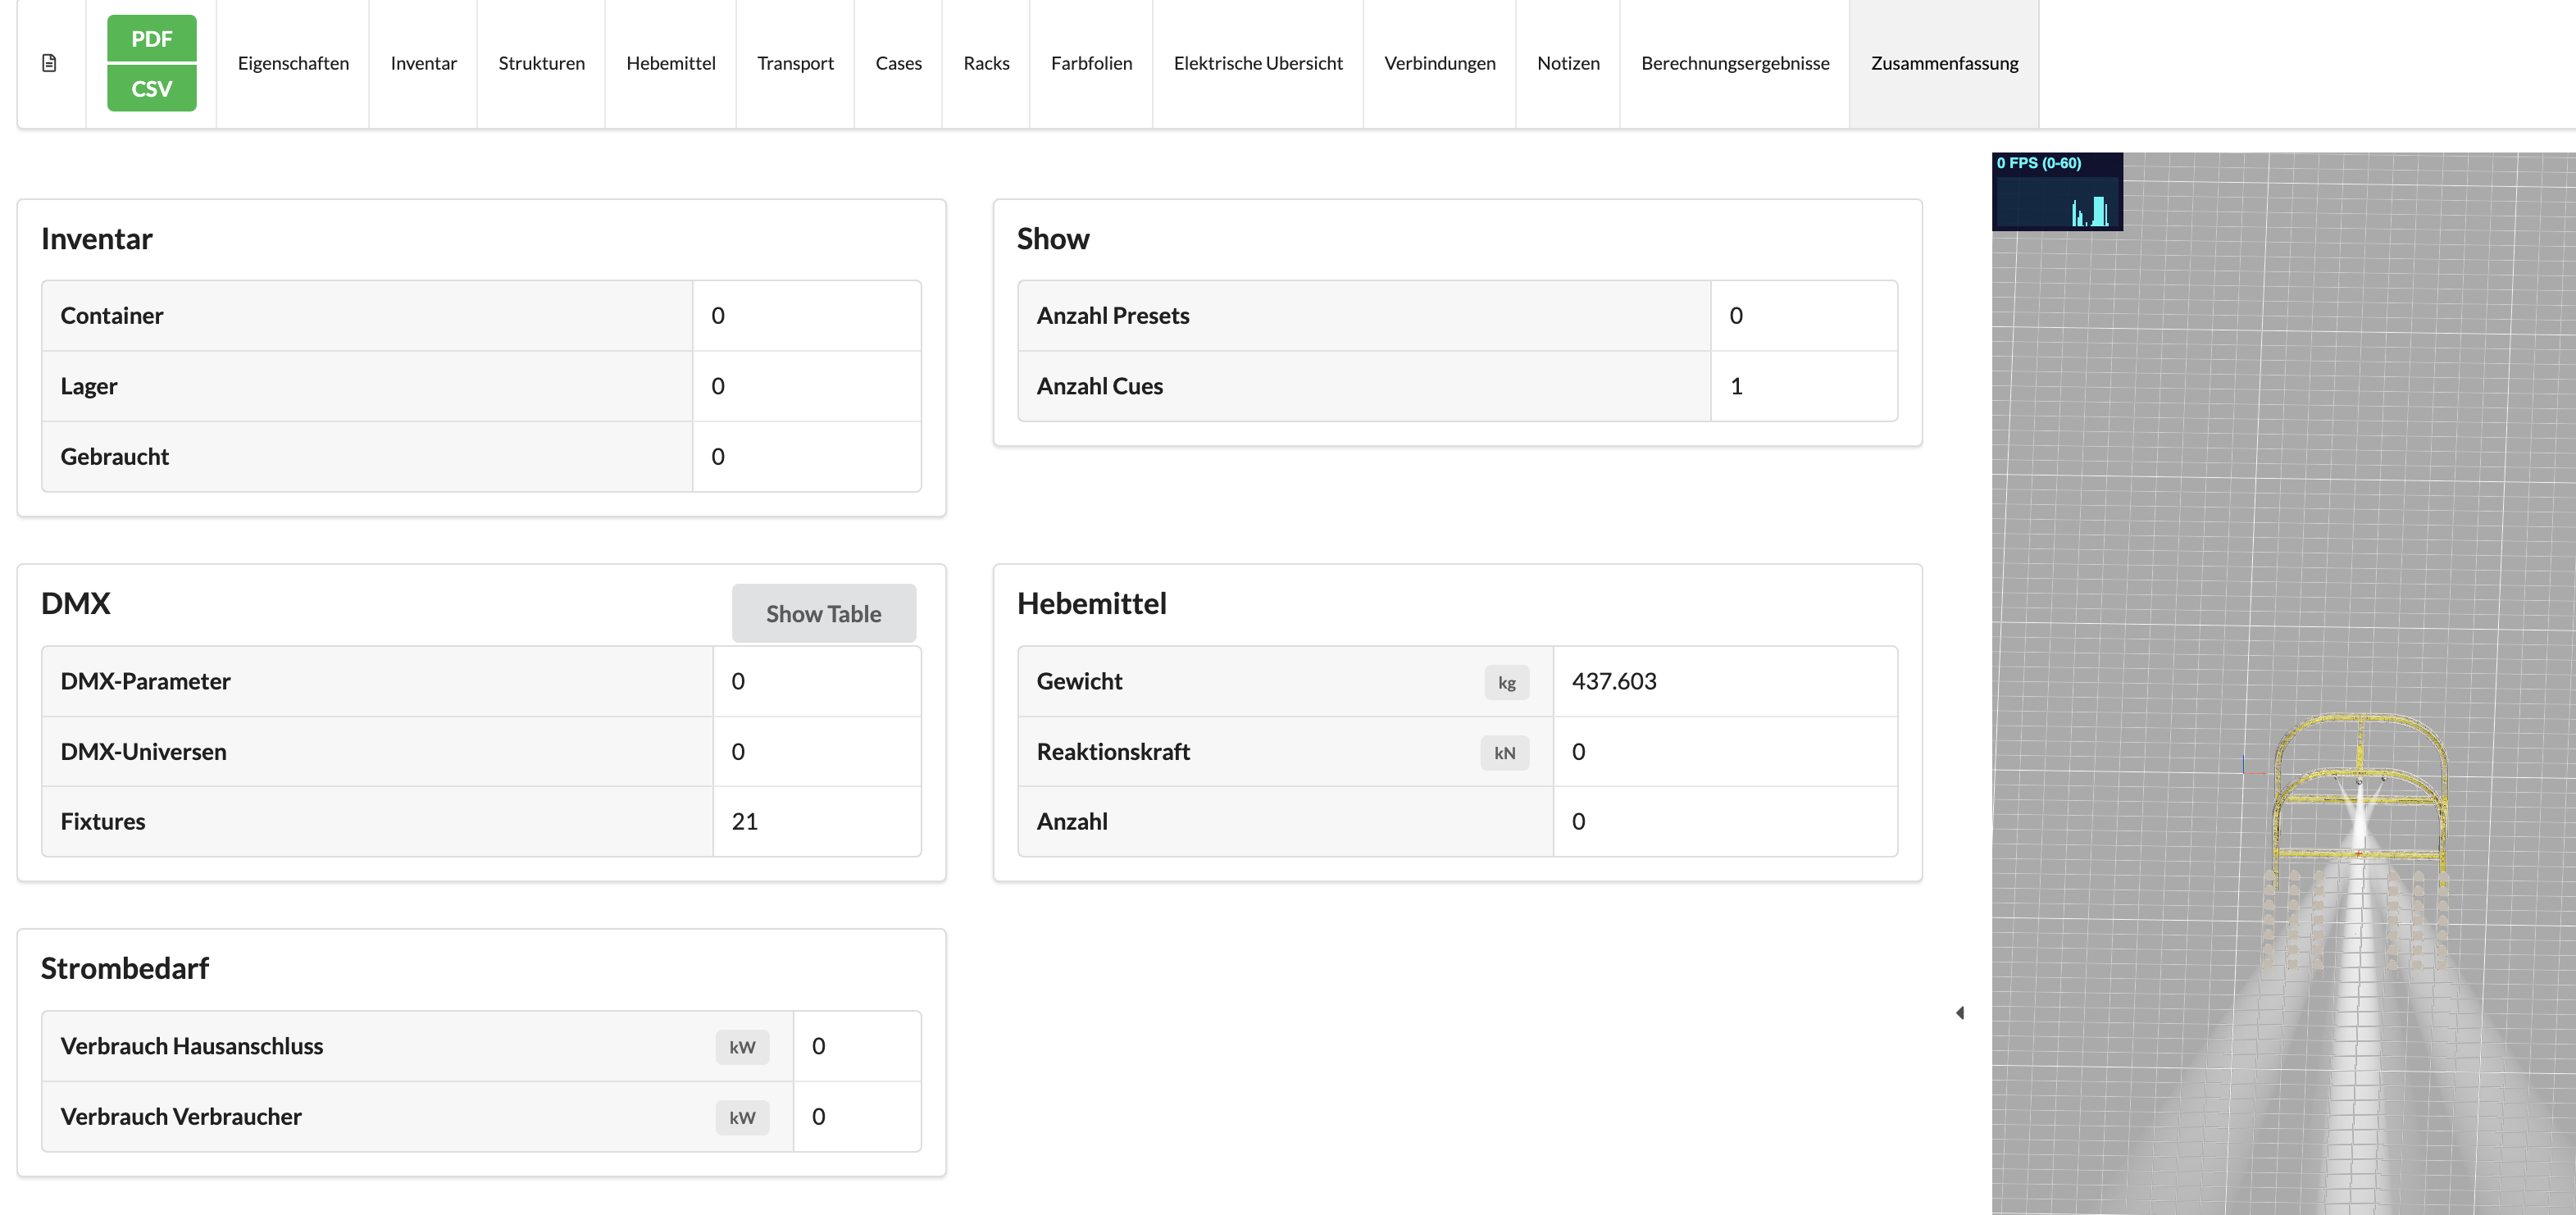
The Summary (Overview) gives you a complete overview of your project. It provides a summary on loads, power requirements, DMX parameter requirements, and trailer requirements.
To export the currently displayed overview/list as a PDF, you must click on the green "PDF" button in the top left. You will then enter the PDF creation menu.

| Name | Description |
|---|---|
| Template Background | Allows selecting a background for the template, either no background or standard background. |
| Paper Templates | Offers various predefined and custom paper formats for export. |
| Custom Format Settings | Opens a menu to customize paper formats. |
| Scaling | Text scaling on the PDF. |
| Public Link for Sharing | Create a link that is embedded in the PDF so people can view your project directly online. |
| Print QR Code and Header | Decide whether you want the QR code and header in the PDF. |
| Print Preview of Current View as PDF | Allows inserting a graphic of the current renderer view above the table. |
| Print Each Group on a New Page | Choose whether to print each of your groups on separate pages. |
| Do Not Print Minimized Groups | Prevents printing minimized groups. |
| Cancel | Aborts the process and closes the window. |
| OK | Confirms the selection and starts the PDF export. |
To make custom settings for the PDF format, you must click the "Custom Format Settings..." button. A menu will then open where you can adjust margins, dimensions, and table settings.

| Name | Description |
|---|---|
| Update Template | Saves changes to the current template. |
| Create Template | Creates a new custom template. |
| Set as Default | Sets the current template as the default for future exports. |
| Select a Paper Template to Copy Size | Opens a list of predefined paper formats to copy the size from. |
| Rotate | Rotates the PDF format (portrait/landscape). |
| Margin Settings | Adjusts the page margins of the PDF. |
| Left Margin | Sets the left page margin. |
| Right Margin | Sets the right page margin. |
| Top Margin | Sets the top page margin. |
| Bottom Margin | Sets the bottom page margin. |
| Height | Defines the height of the PDF page. |
| Width | Defines the width of the PDF page. |

| Name | Description |
|---|---|
| Format Definition | Expands the settings for paper format. |
| Font | Selects the font for the PDF text. |
| Font Size | Sets the font size. |
| Text Style (B/U/I) | Allows formatting text as bold (B), underlined (U), or italic (I). |
| Text Color | Defines the color of the text in the PDF. |
| Space Before | Sets the top space of an element. |
| Space After | Sets the bottom space of an element. |

| Name | Description |
|---|---|
| Table Definition | Contains options for customizing table borders, headers, and cell formatting. |
| Custom Settings for Outer Table Borders | Enables custom settings for outer table borders. |
| Alternate Cell Colors | Colors every other table cell with custom settings. |
| Table Borders | Defines the outer and inner borders of the table. |
| Headers | Settings for table headers. |
| Group Headers | Formatting options for group headers in tables. |
| Cells | Adjusting cell colors, spacing, and border lines. |
| Alternate Cells | Configures colors and styles for alternating cell backgrounds. |
| Cell Color | Sets the background color of a cell. |
| Line Style | Determines the style of table lines (e.g., solid, dashed). |
| Line Color | Defines the color of table lines. |
| Line Width | Sets the thickness of table lines. |
| Inner Distance | Defines the spacing within a cell. |
| Copy from Previous Page | Adopts the settings from the previous page. |
| Apply to All Pages | Applies the settings to all pages. |
| Position (Top, Bottom, Left, Right, Content) | Determines the placement of table contents and frames. |
| OK | Confirms the settings and saves the changes. |
Then click Export PDF and save it under the desired name.